🌍 Public
Fork of Reusable scatterplot
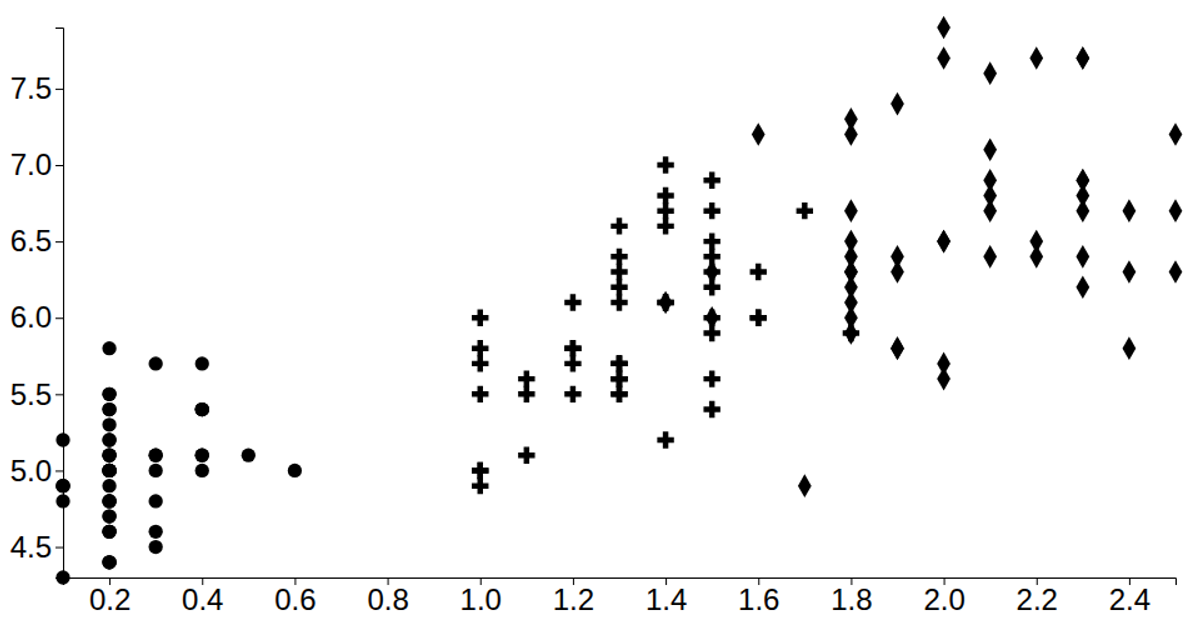
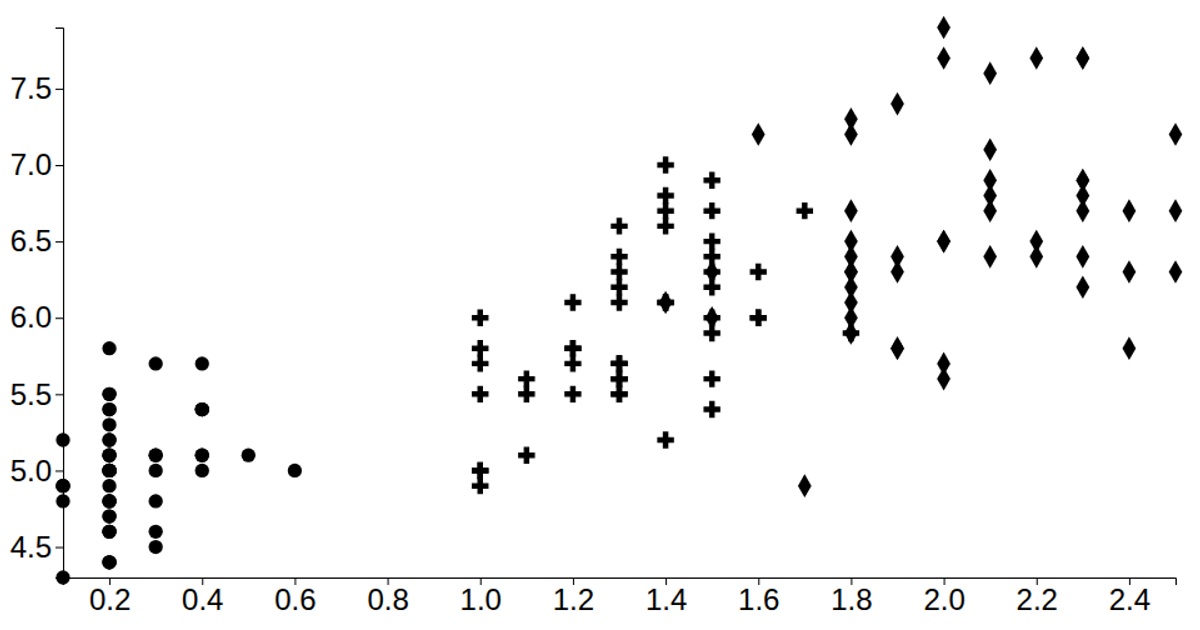
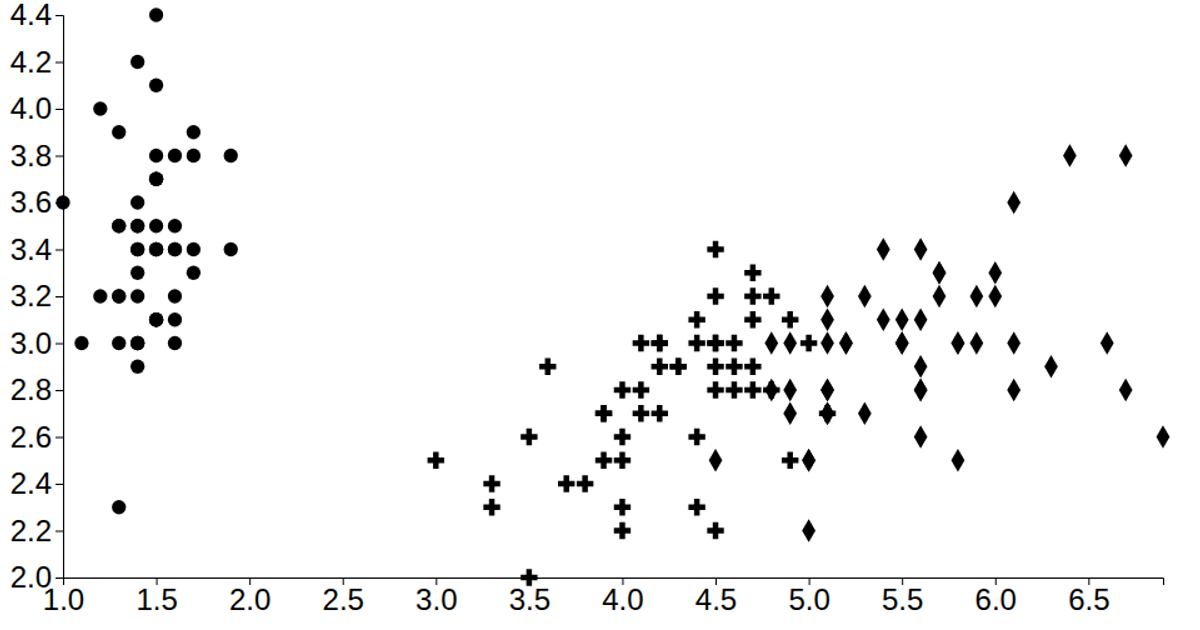
This example visualizes the classic Iris dataset, showing the relationship between petal length and petal width. Each flower is drawn as a distinct SVG path symbol, with different symbol types corresponding to the three Iris species, and color encoding species using the viridis scale. The code imports from D3 v6, using `scaleLinear` for axes, `scaleOrdinal` for symbol and color mapping, and the `symbol` generator to create shapes. It loads data from a CSV file hosted on GitHub and renders within a full-screen SVG.
AI-generated descriptionMIT Licensed





Comments
Sign in to join the discussion.