🌍 Public
Pie Chart
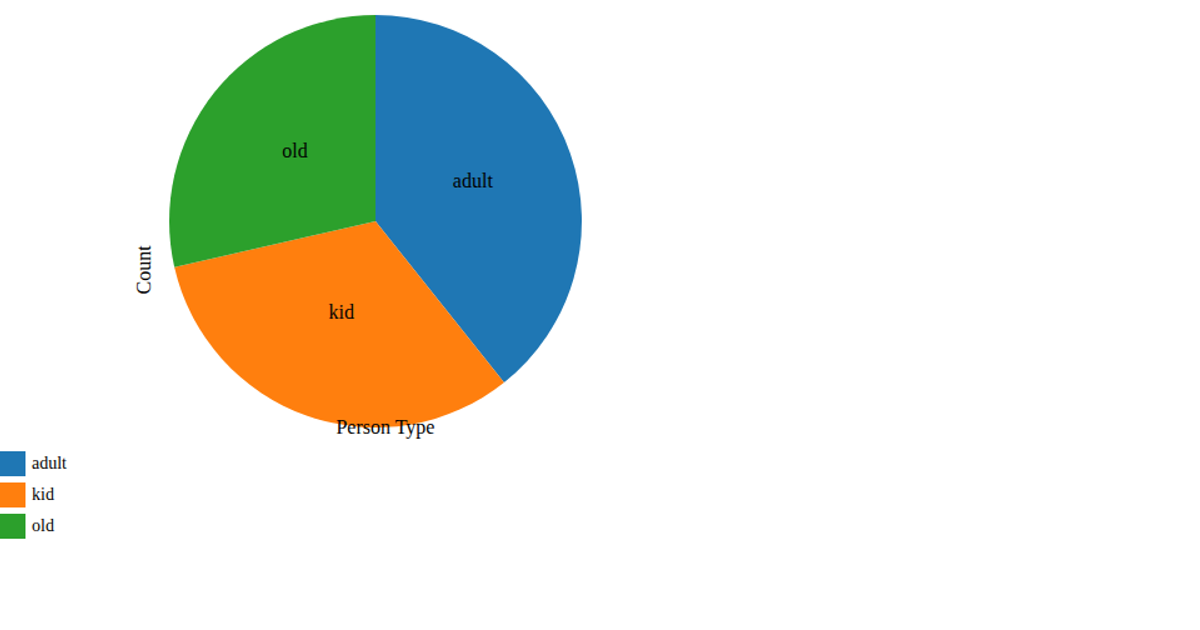
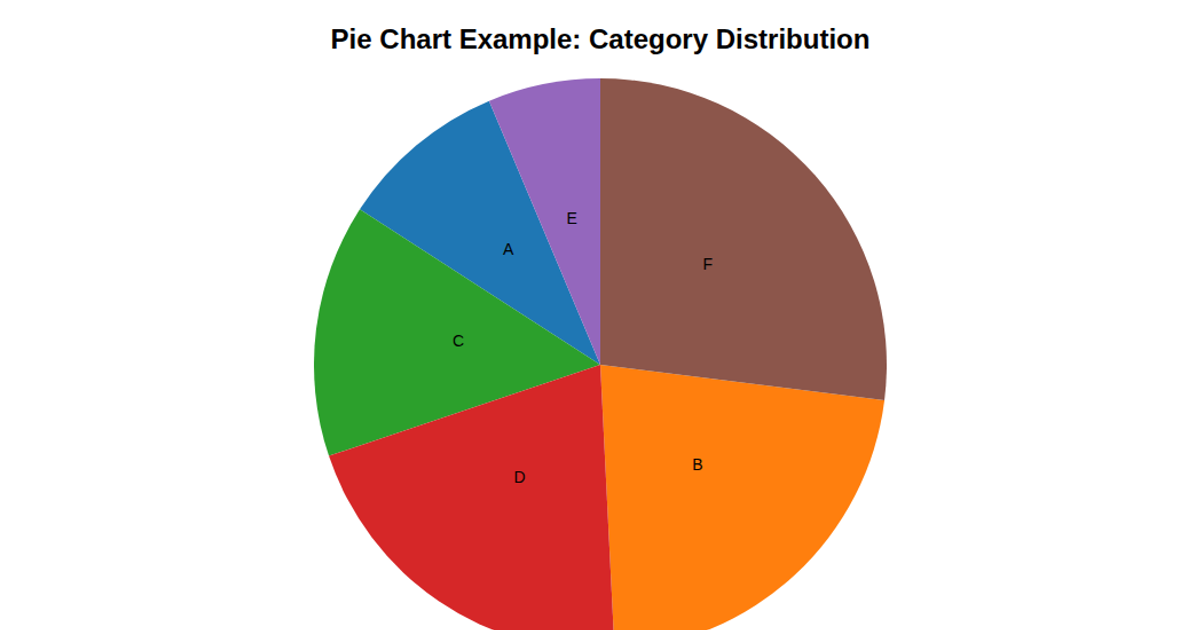
This pie chart visualizes the distribution of gender categories from the Heart2020Cleaned dataset, with each slice proportionally representing the count of occurrences per category. The visualization uses D3 v7’s `d3.rollup`, `d3.pie`, and `d3.arc` to compute and render the slices, while a categorical color scale (`d3.scaleOrdinal` with `d3.schemeCategory10`) distinguishes each group. A legend with colored rectangles and text labels displays each category name alongside its count, rendered as SVG within a Bootstrap-styled HTML page.
AI-generated descriptionA bare minimum HTML page demonstrating use of CSS and JavaScript.
See also React Starter.
MIT Licensed




Comments
Sign in to join the discussion.