🌍 Public
Sriram ICE 7 Area Chart
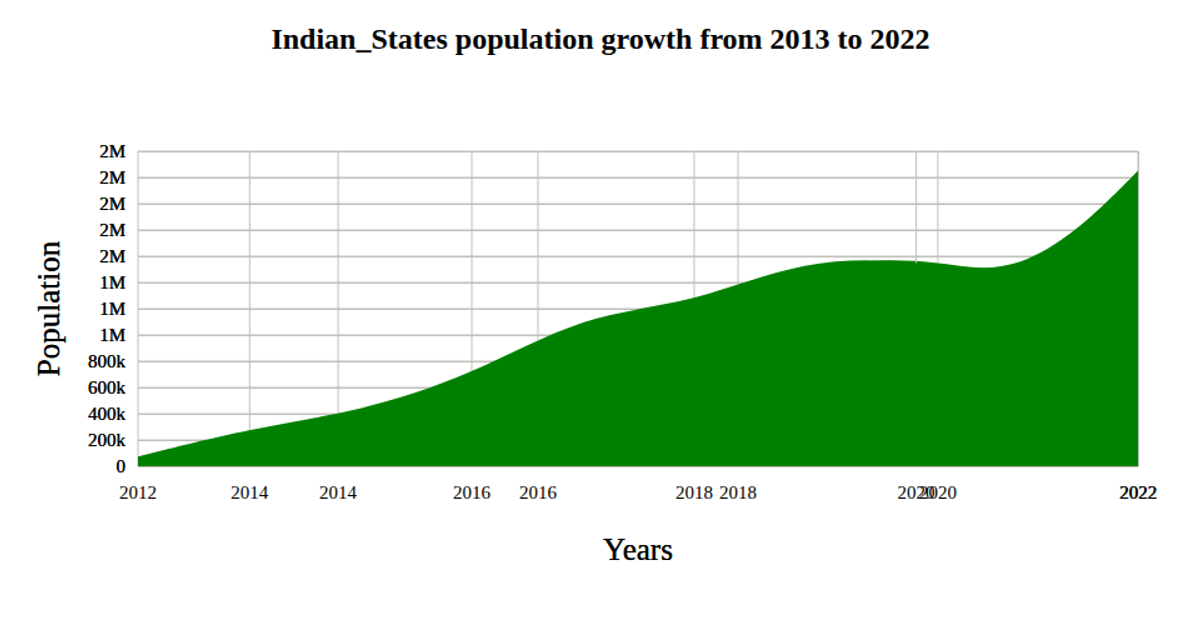
This area chart visualizes world population growth over time, using a red filled region with a thick steelblue outline to emphasize the data trend. The visualization loads CSV data from a GitHub gist, parsing years as dates and population values as numbers. Built with D3 v5, it employs `scaleTime`, `scaleLinear`, `area`, and `curveBasis` to generate the smooth path, alongside `axisBottom` and `axisLeft` for labeled axes with custom tick formatting.
AI-generated descriptionA Minimal Example illustrating the basic structure of a Vizhub visualization.
MIT Licensed




Comments
Sign in to join the discussion.