🌍 Public
Activity_9-pie chart
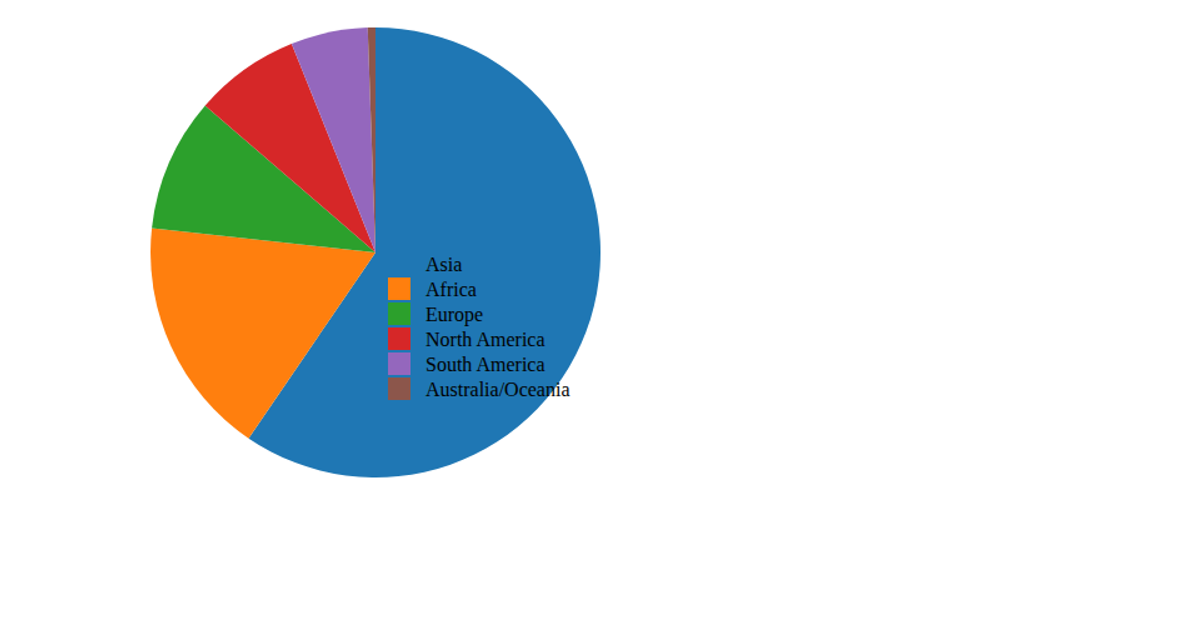
This pie chart visualizes Canadian immigrant data from 2013, showing the proportion of immigrants from each continent. The chart uses D3.js v6 to create an SVG pie layout with `d3.pie()` and `d3.arc()`, coloring each slice with a hue based on its index. Hovering over a slice displays a tooltip with the continent’s percentage of the total, calculated via `d3.sum()`. A legend accompanies the chart, listing each continent and its exact immigrant value. The data loads from a remote CSV file via `d3.csv()`.
AI-generated descriptionMIT Licensed



Comments
Sign in to join the discussion.