🌍 Public
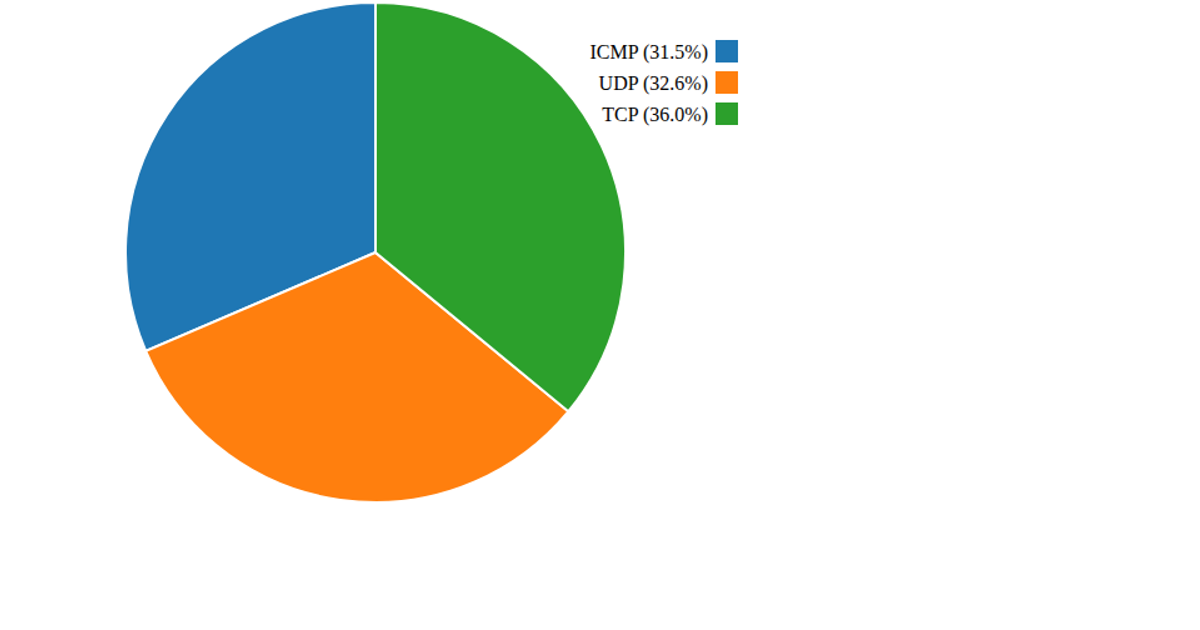
Pie plot cyber attacks protocols
This pie chart visualizes the distribution of cyber attack protocols from a CSV dataset, showing the proportional share of each protocol as colored slices with a legend displaying labels and percentage values. The visualization uses D3 v6 to load the data, counts occurrences of each protocol value, and renders the chart as SVG using `d3.pie` and `d3.arc` generators. A categorical color scale from `d3.scaleOrdinal` with `schemeCategory10` colors the slices, while the legend is built manually with SVG rectangles and text elements.
AI-generated descriptionMIT Licensed


Comments
Sign in to join the discussion.