🌍 Public
Click to select with D3.js!
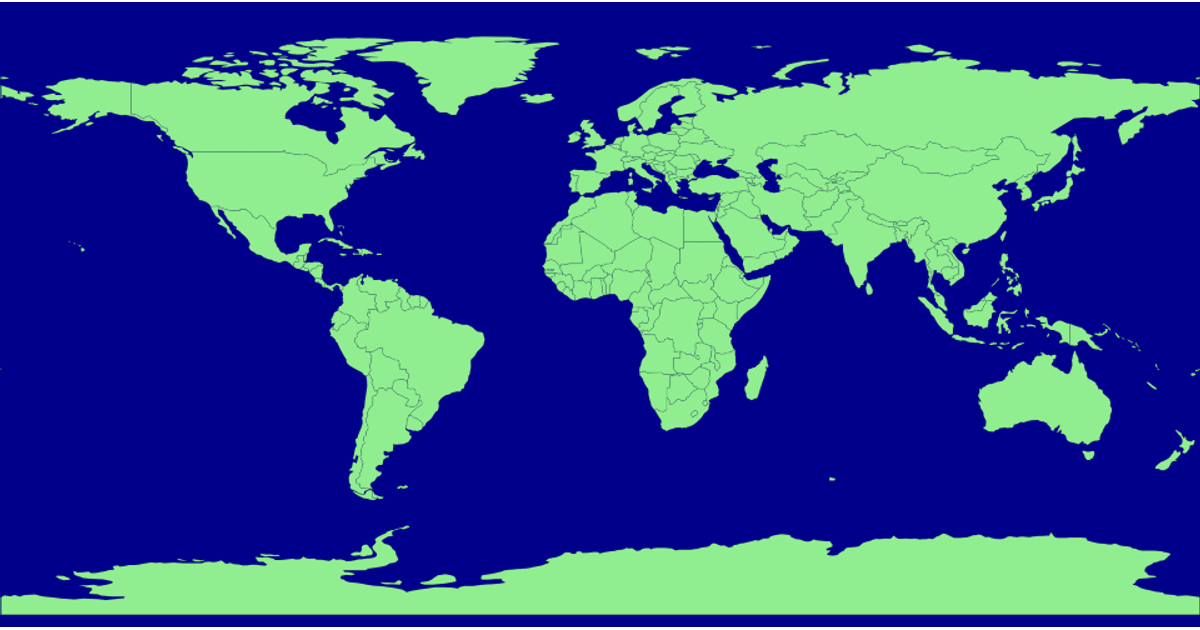
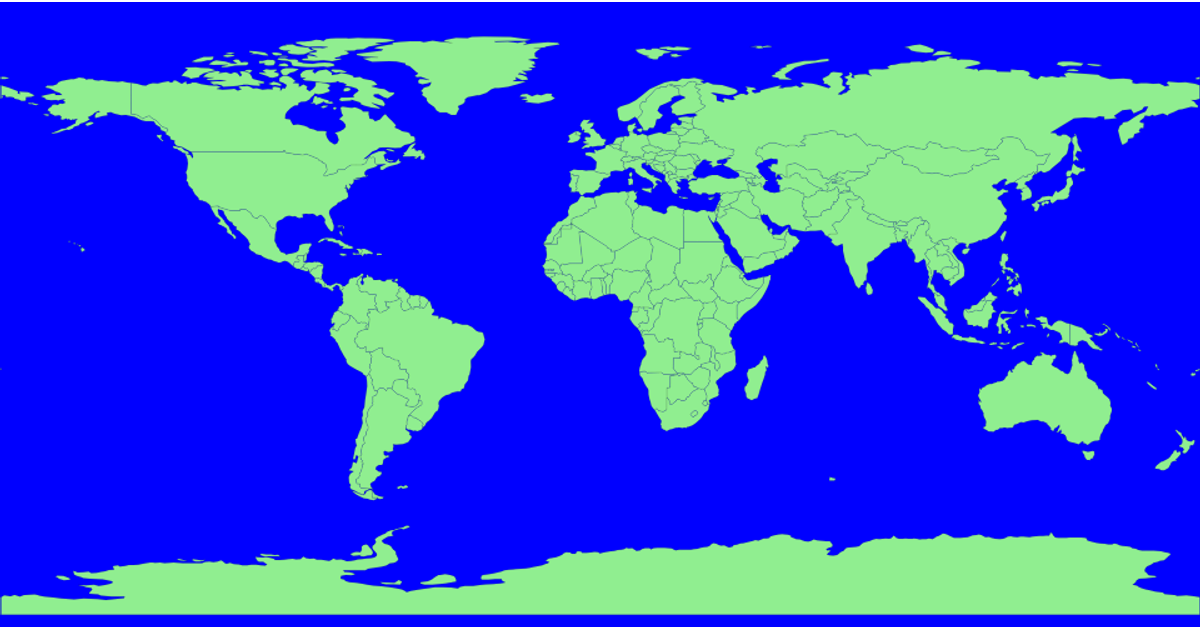
This example displays a world map using an equirectangular projection, with each country rendered as a green SVG path with a black stroke. The data is loaded from the world-atlas TopoJSON dataset and converted to GeoJSON features via `topojson.feature`. The visualization relies on D3 v6’s `d3.json`, `d3.geoEquirectangular`, and `d3.geoPath` to generate the map geometry, and appends all paths to the SVG container at once. No click interaction or selection behavior is implemented beyond the title’s suggestion.
AI-generated descriptionMIT Licensed



Comments
Sign in to join the discussion.