🌍 Public
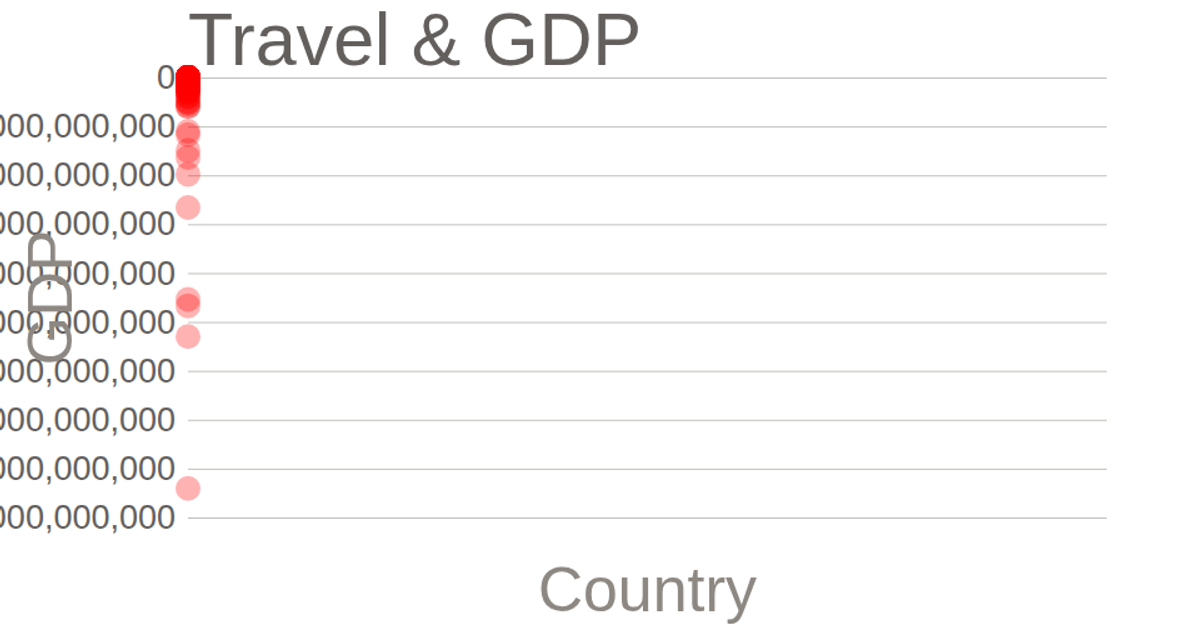
Travel v/s GDP
This example shows a world map of international tourism receipts in 2015, colored by magnitude to compare travel revenue against GDP. Hovering reveals each country’s exact value, and users can zoom and pan the map. It uses D3’s `geoNaturalEarth1` projection with `geoPath` for rendering, plus D3’s `zoom` behavior for interactivity. The map loads country boundaries from TopoJSON and data from a CSV file, while `scaleOrdinal` and `schemeGreens` drive the color legend.
AI-generated descriptionA 2015 world map of Internet Users Dataset. This iteration adds hover and zoom.
MIT Licensed





Comments
Sign in to join the discussion.