🌍 Public
activity6_Ans1_NRS
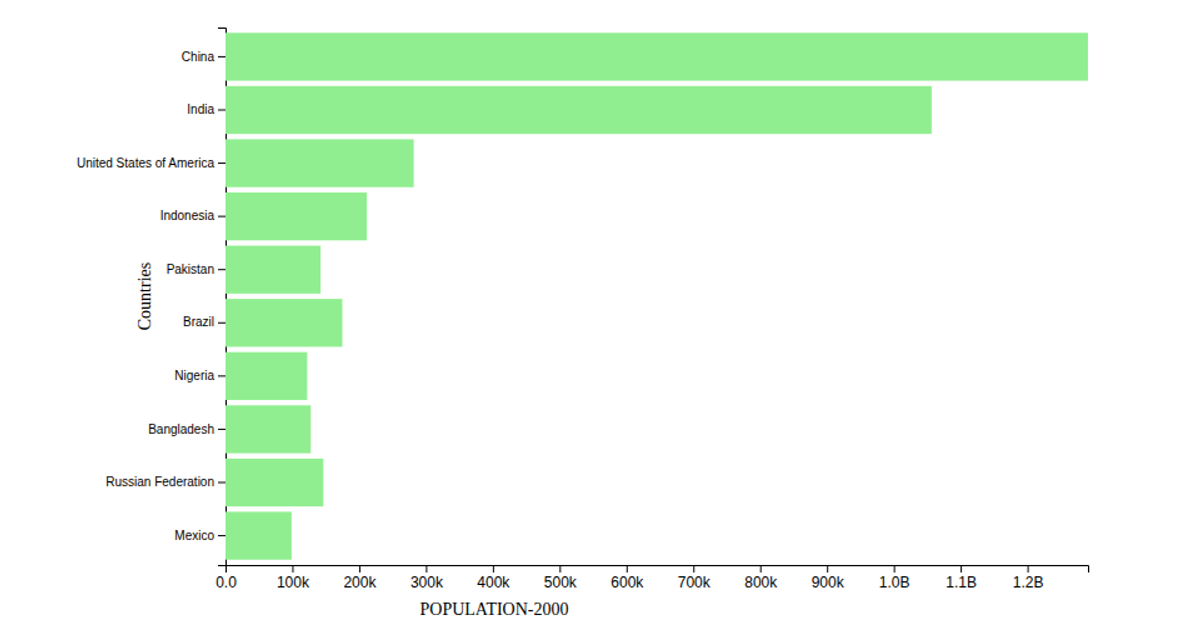
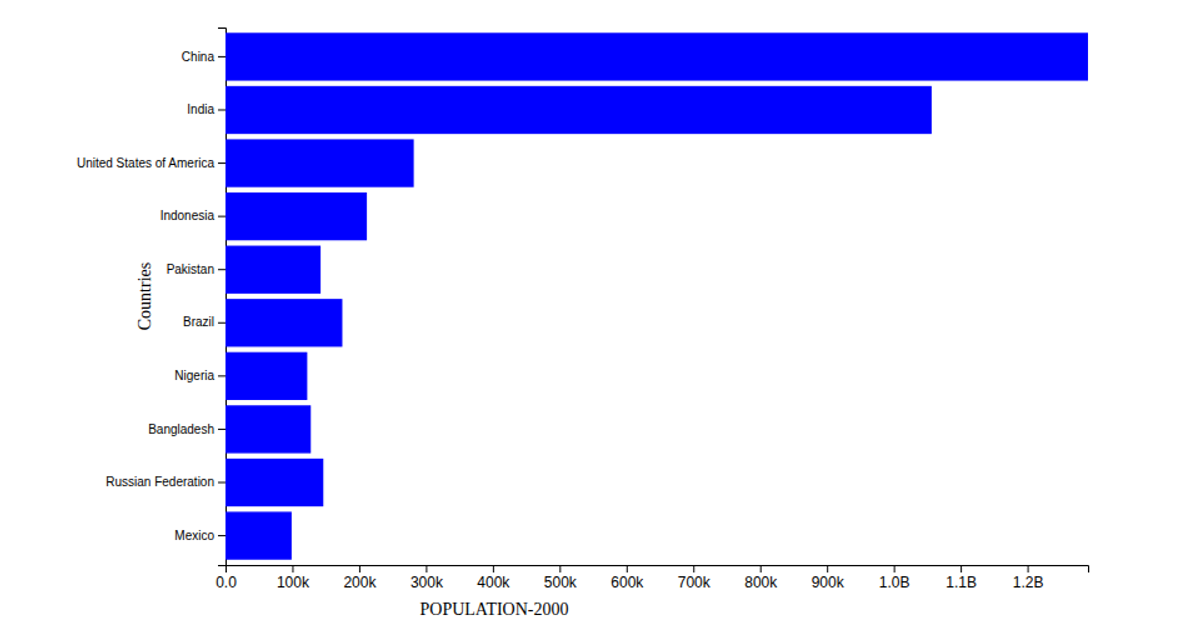
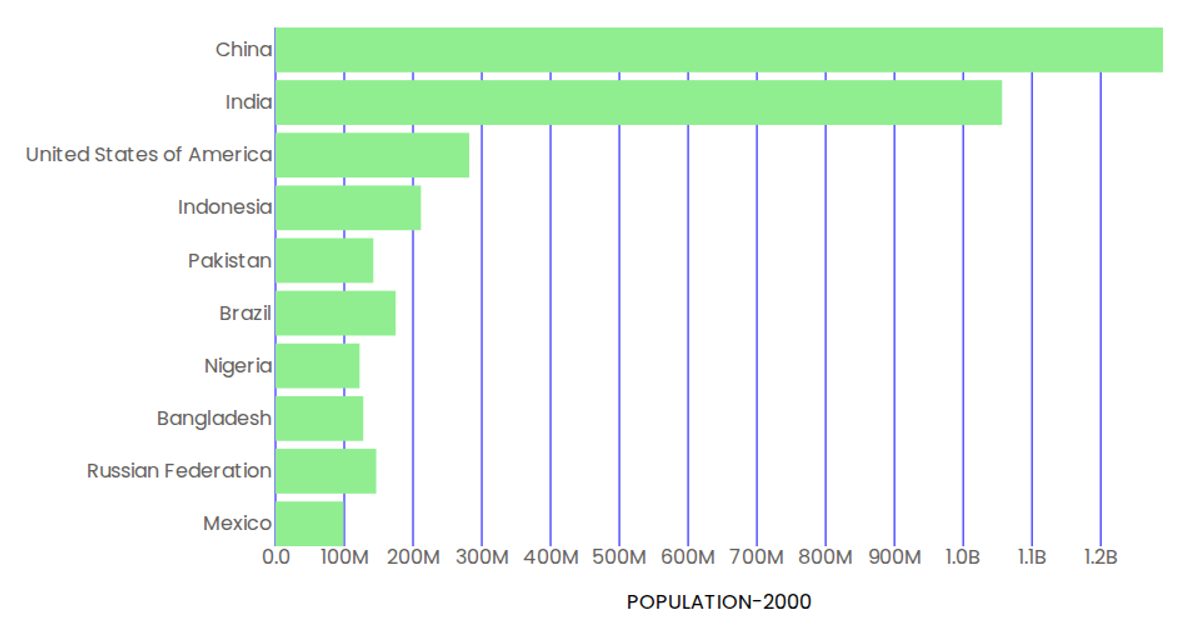
This visualization displays a horizontal bar chart of the top 10 most populous countries in the year 2000, with countries sorted in descending order along the y-axis and population values on the x-axis. The chart uses D3 v7’s scaleBand and scaleLinear to position bars, which are rendered as SVG rectangles filled with light green. Axis labels are added via the d3.axisBottom and d3.axisLeft APIs, with custom tick formatting converting values from millions to billions. The data is loaded asynchronously from a CSV file hosted on GitHub using d3.csv, then filtered and sorted to extract the top 10 entries.
AI-generated descriptionMIT Licensed



Comments
Sign in to join the discussion.