🌍 Public
Fork of Let's make a map with D3.js!
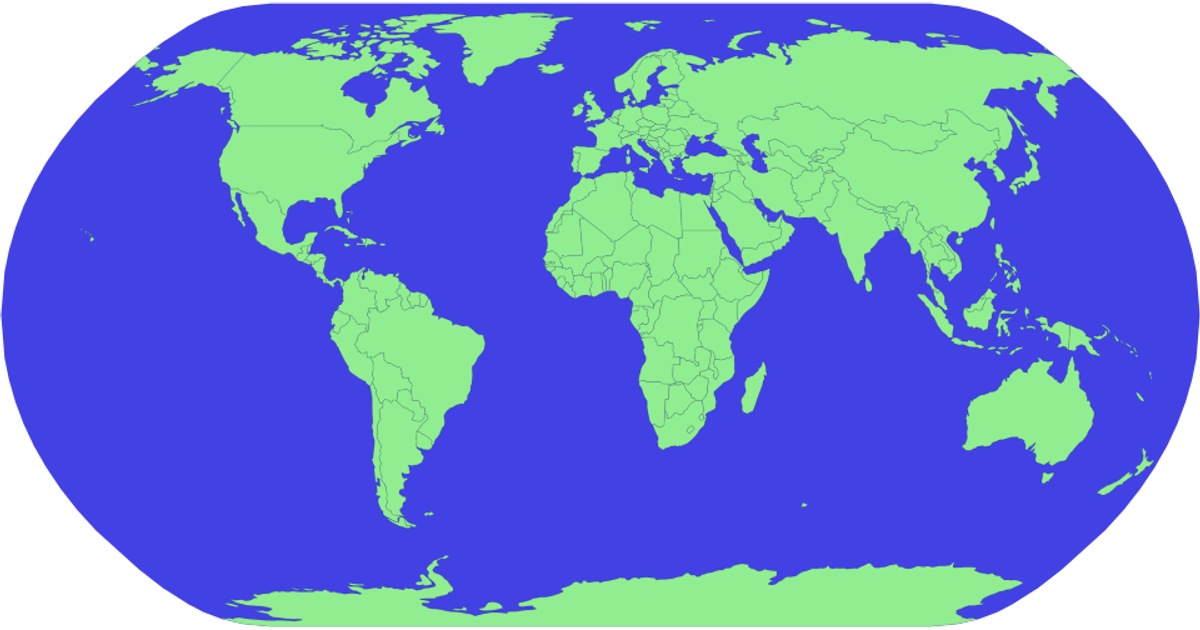
This map visualization renders the entire world using D3.js v5 and the TopoJSON library. It displays countries as light green filled paths with a blue sphere background, using the `geoNaturalEarth1` projection. Country boundaries come from the world-atlas dataset loaded via the `json` function, and the `geoPath` API generates the SVG paths that make up the map.
AI-generated descriptionMIT Licensed




Comments
Sign in to join the discussion.