🌍 Public
World Map using d3.js
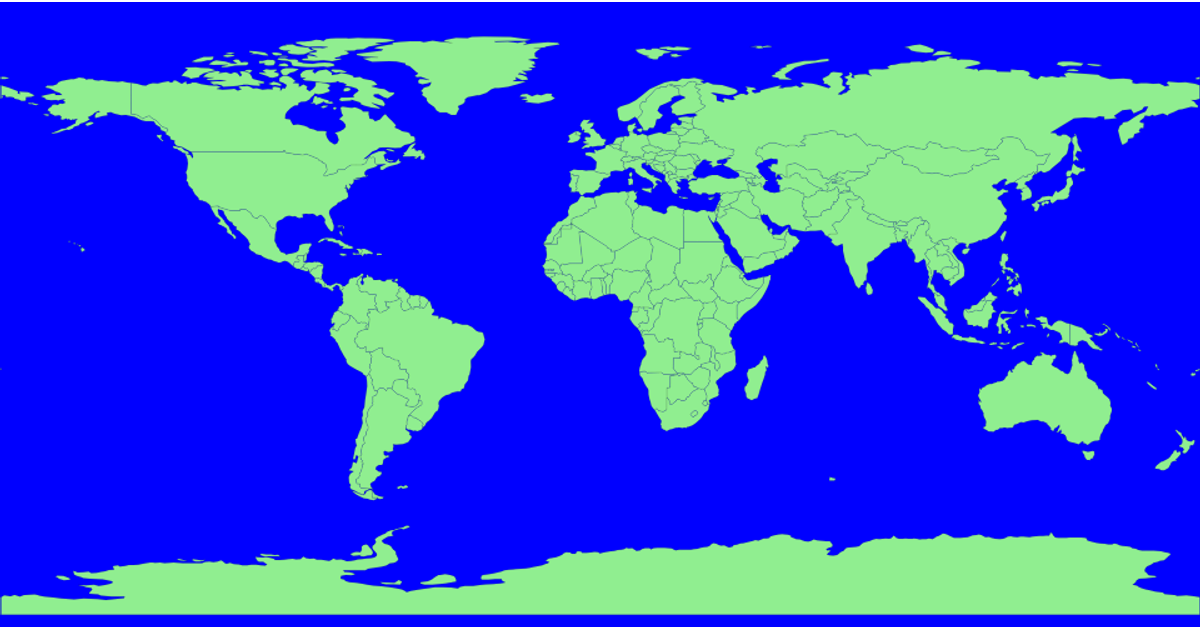
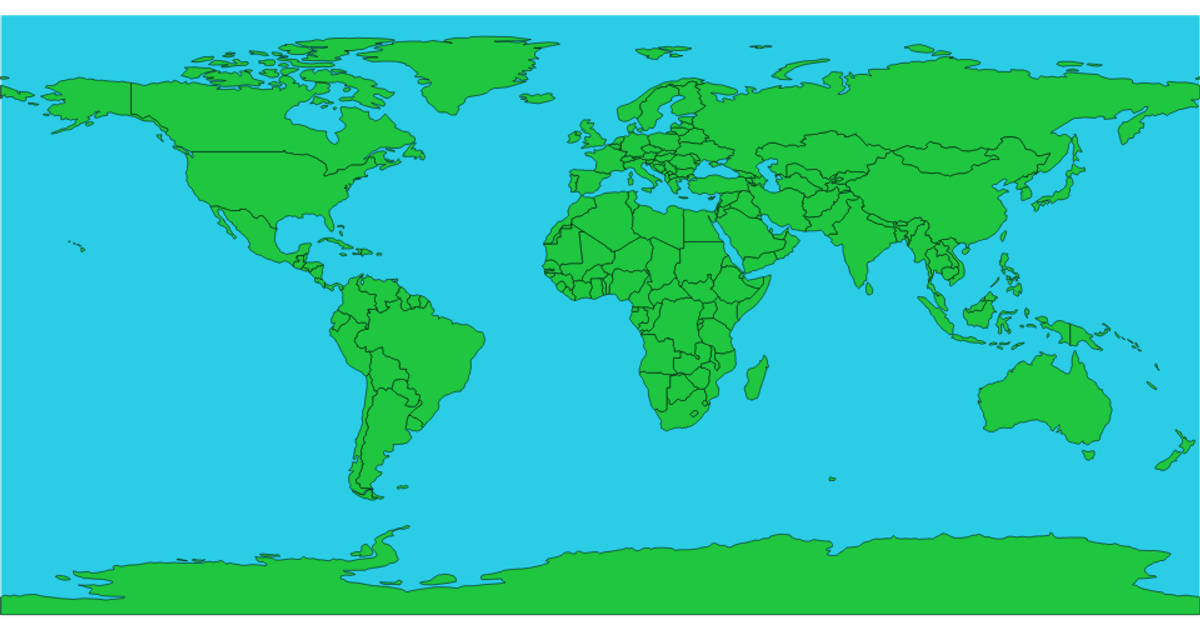
This example displays a world map using the Eckert I projection, with countries rendered in green against a black spherical outline. It loads geographic data from the world-atlas TopoJSON dataset and converts it to GeoJSON using `topojson.feature`. The visualization uses `d3.geoPath` to generate SVG paths from the projected geometry, with `d3-geo-projection` providing the projection function. Each country is drawn as a distinct path element with stroke and fill styling defined in CSS.
AI-generated descriptionMIT Licensed



Comments
Sign in to join the discussion.