🌍 Public
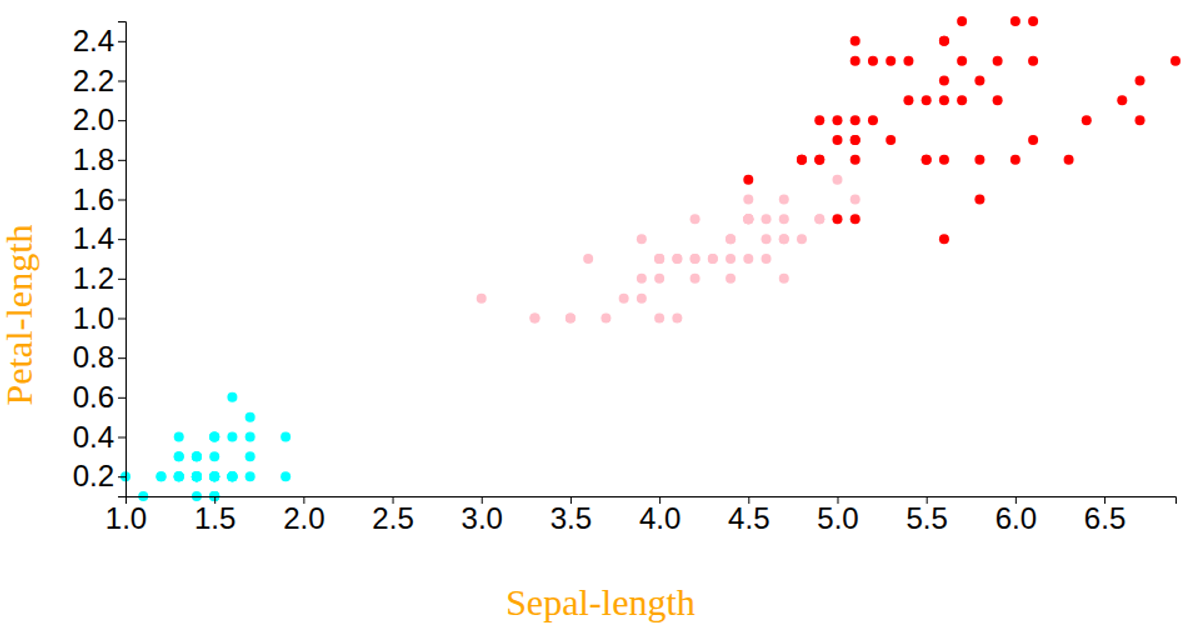
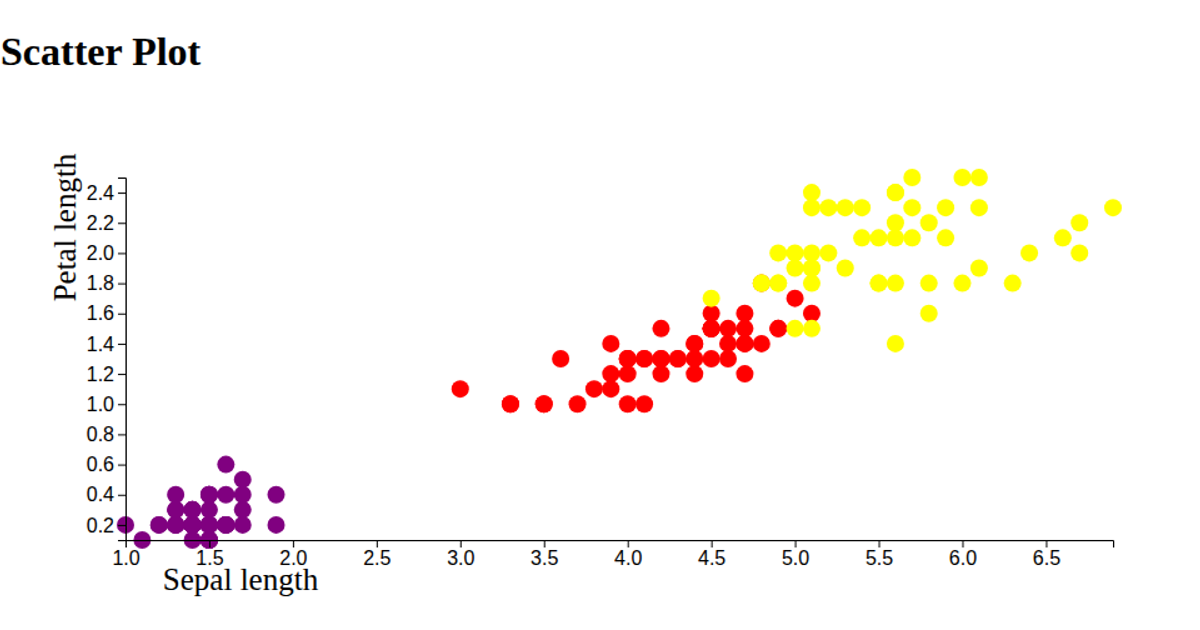
Fork of Charan - Scatter Plot using Iris dataset
This interactive scatter plot visualizes the Iris dataset, mapping petal length and petal width on the x- and y-axes while encoding species with distinct colors (aqua, pink, red) and using sepal dimensions to modulate marker size via the `rx` and `ry` attributes. Built with React and D3 v6, the example fetches CSV data from a remote gist, uses `scaleLinear` and `extent` to compute scales, and renders circles with SVG, adding styled axis labels and ticks via `axisBottom` and `axisLeft`.
AI-generated descriptionA bare minimum HTML page demonstrating use of CSS and JavaScript.
See also React Starter.
MIT Licensed




Comments
Sign in to join the discussion.