🌍 Public
temp
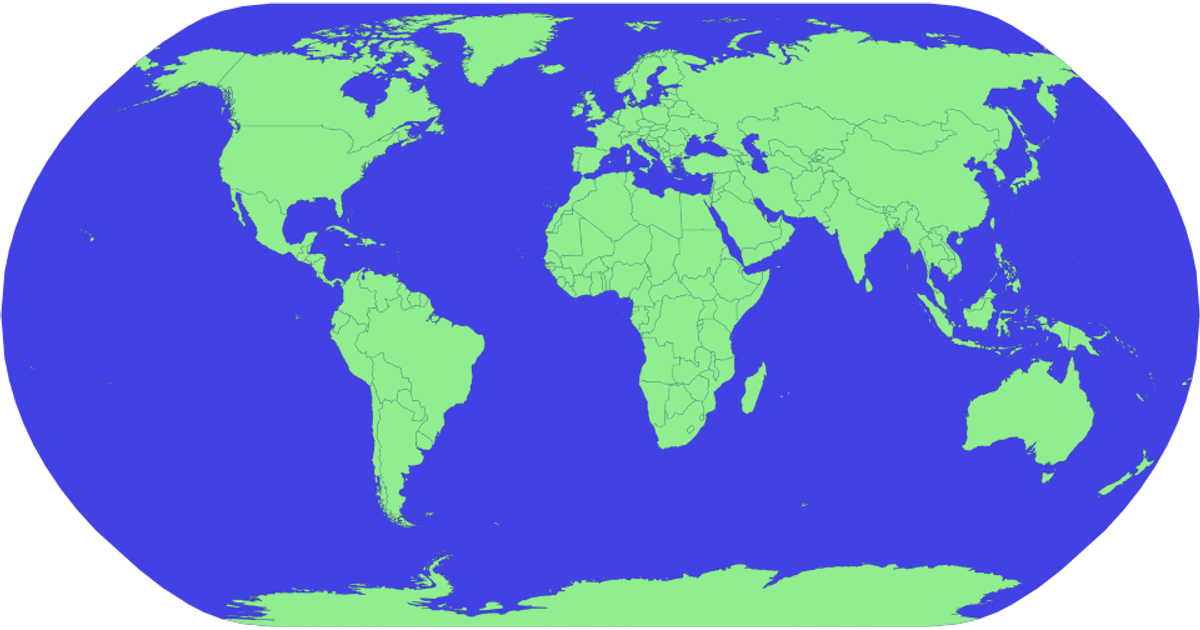
This example displays a world map with countries colored blue, except Canada, which is rendered in pink. It uses the `d3.geoPath` and `d3.geoNaturalEarth1` projections to draw geographic boundaries from the World Atlas TopoJSON and TSV data. The map supports zooming and panning via the `zoom` event, and hovering over a country turns it red. Country names appear as tooltips using the `title` element.
AI-generated descriptionMIT Licensed




Comments
Sign in to join the discussion.