🌍 Public
web page
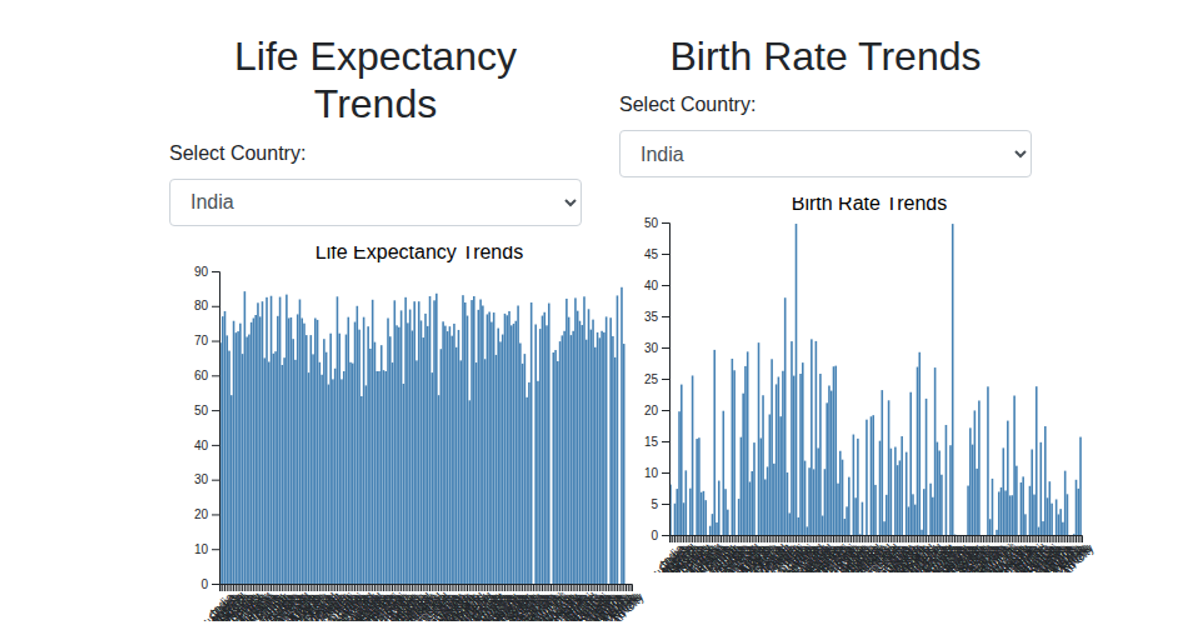
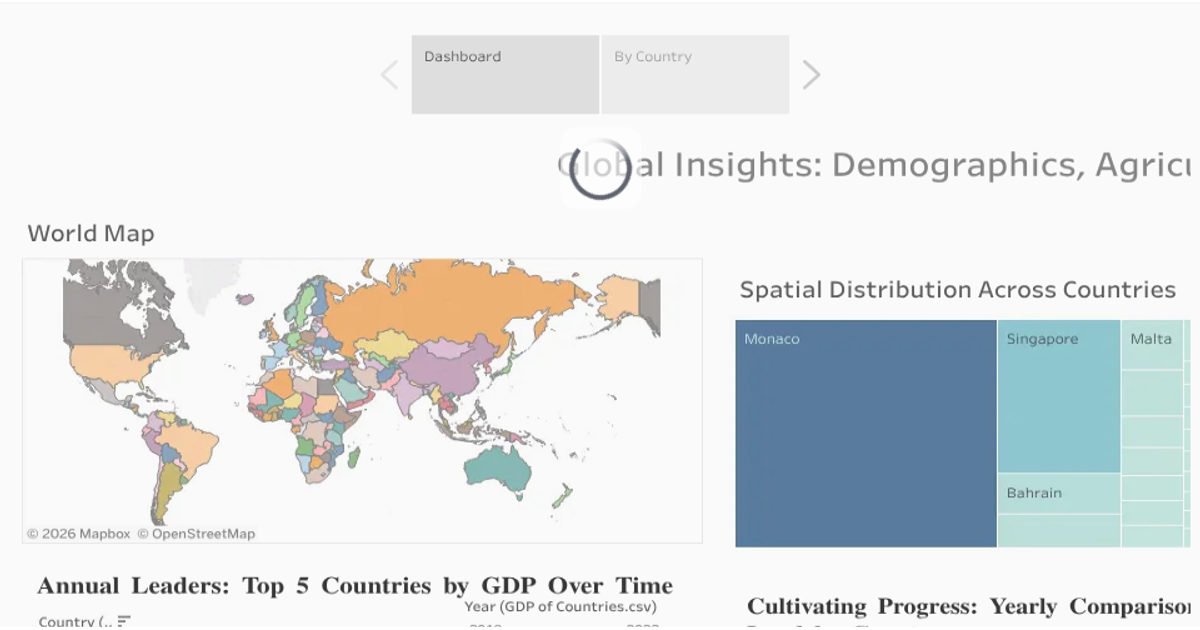
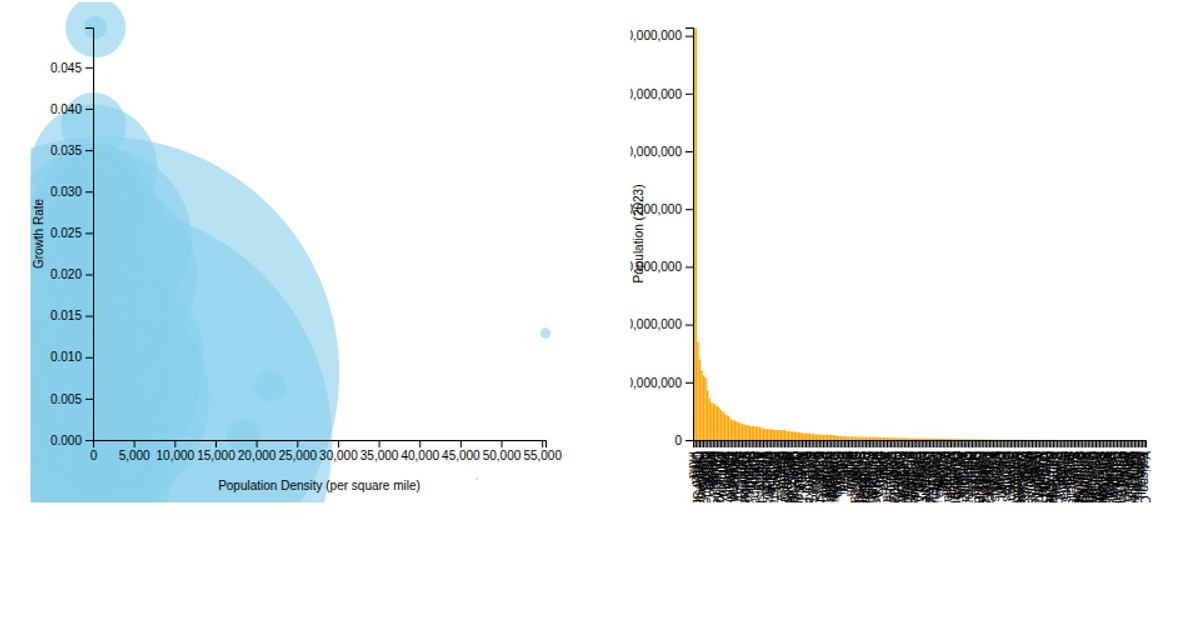
This gallery presents a collection of charts examining global demographic and economic indicators. The visualizations cover topics like population growth, land area, CO2 emissions, GDP, and life expectancy. The examples are rendered with a variety of tools, including static images created with Python and interactive maps built with D3.js. A Tableau dashboard is also included, showing population rankings and tax revenue. The D3.js visualizations use geospatial and scatter plot techniques, while the Python charts rely on data plotting libraries.
AI-generated descriptionMIT Licensed


Comments
Sign in to join the discussion.