🌍 Public
Country Map ICE-8
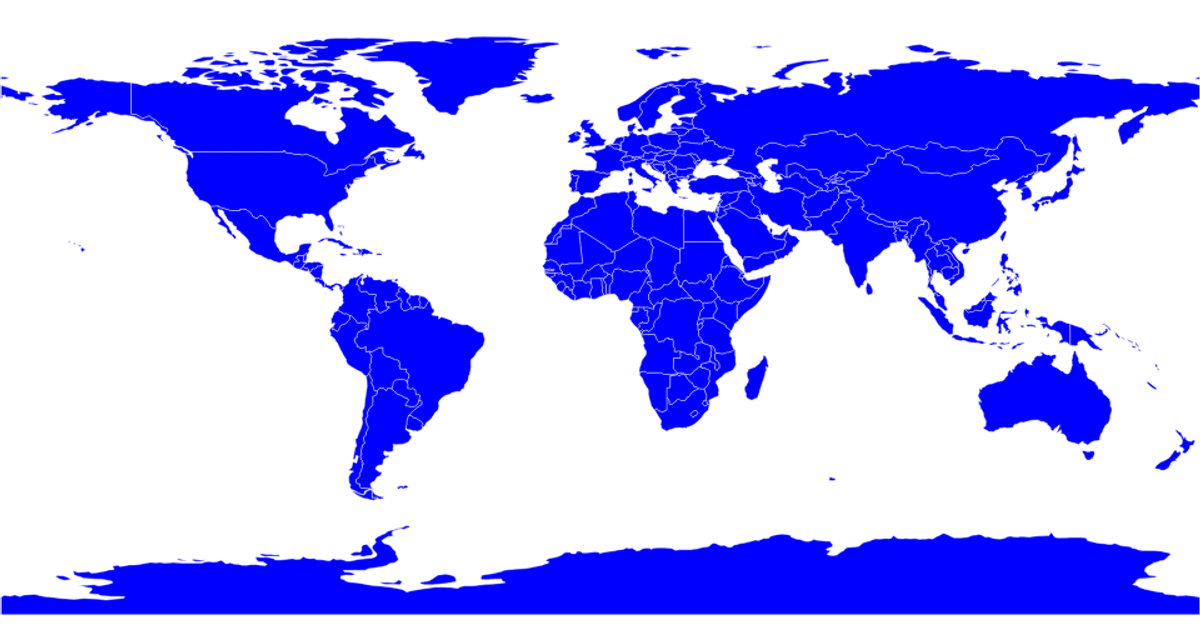
This visualization displays Indonesia as a violet-colored country on a green background, extracted from a global TopoJSON dataset of country boundaries. The code uses d3.geoAlbersUsa to project the geographic coordinates and d3.geoPath to generate SVG paths, filtering the world data to isolate Indonesia. It loads country polygons from the world-atlas TopoJSON file and renders the selected feature onto a 960×500 SVG canvas. The projection is scaled to 780 and translated to center the map, with each path styled via a CSS class.
AI-generated descriptionMIT Licensed



Comments
Sign in to join the discussion.