🌍 Public
TemperatureDay_LineChart
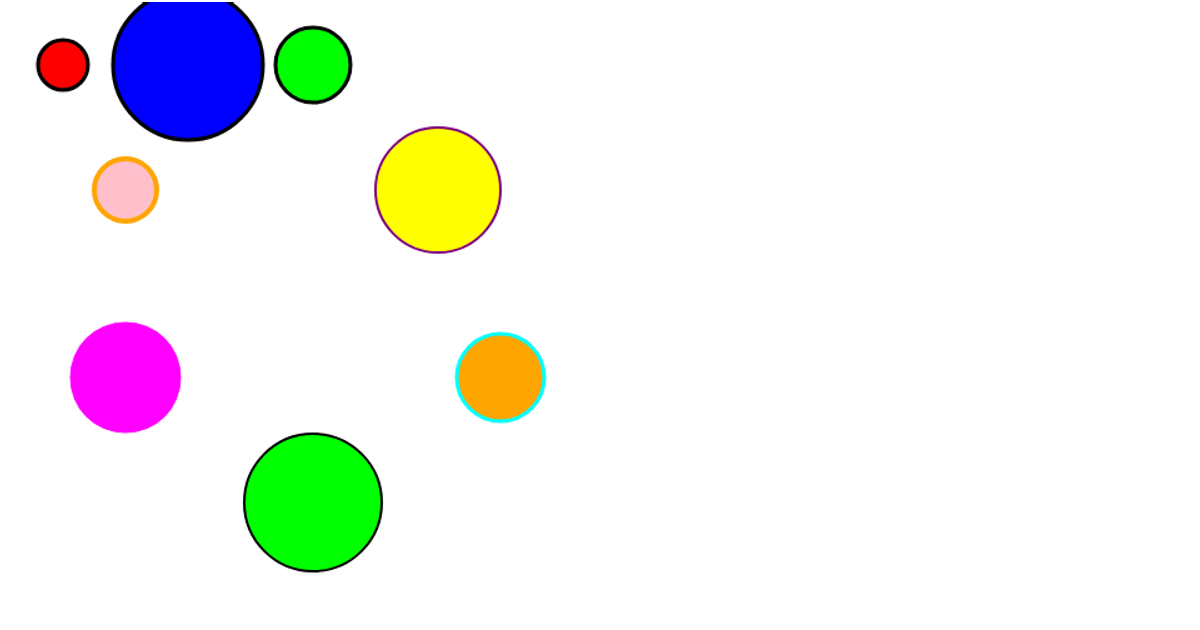
This example shows seven colored circles arranged across a canvas, where clicking any circle highlights it with a black border and brings it to the front. The visualization uses D3 v7’s selection methods (`selectAll`, `join`, `attr`) to render the SVG elements, with explicit `click` event listeners managing state through a unidirectional data flow pattern. A custom `unidirectionalDataFlow` helper coordinates state updates, while `setupSVG` initializes the responsive full-screen SVG container and `renderCircles` handles the circle rendering and interaction highlighting.
AI-generated descriptionMIT Licensed




Comments
Sign in to join the discussion.