🌍 Public
FP: Parallel Coordinates
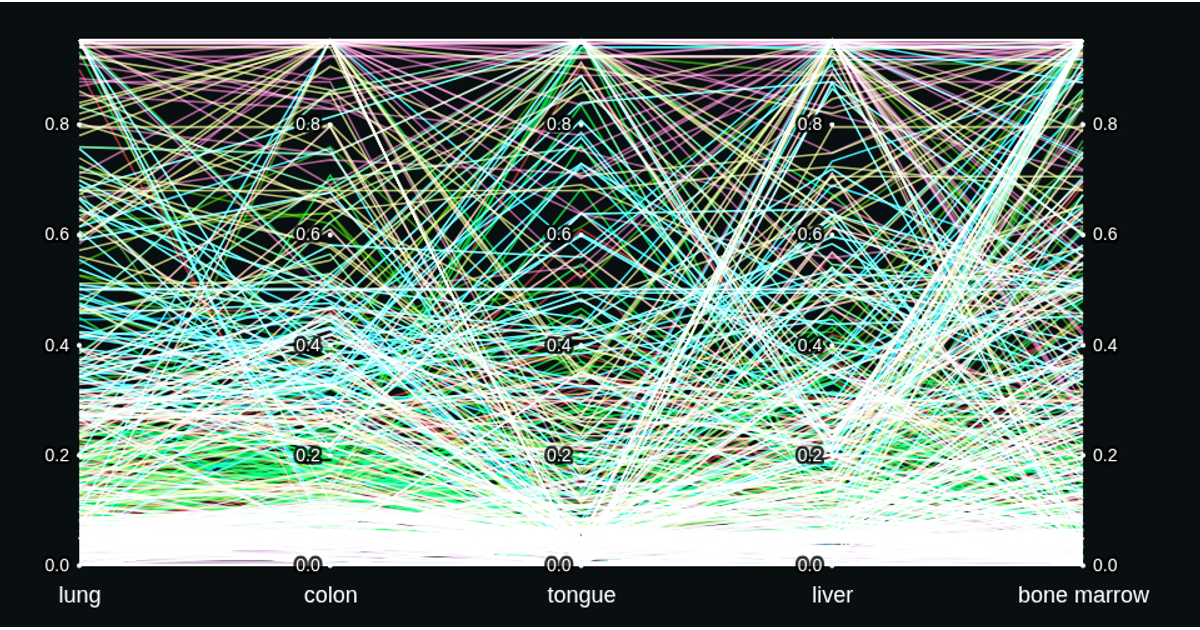
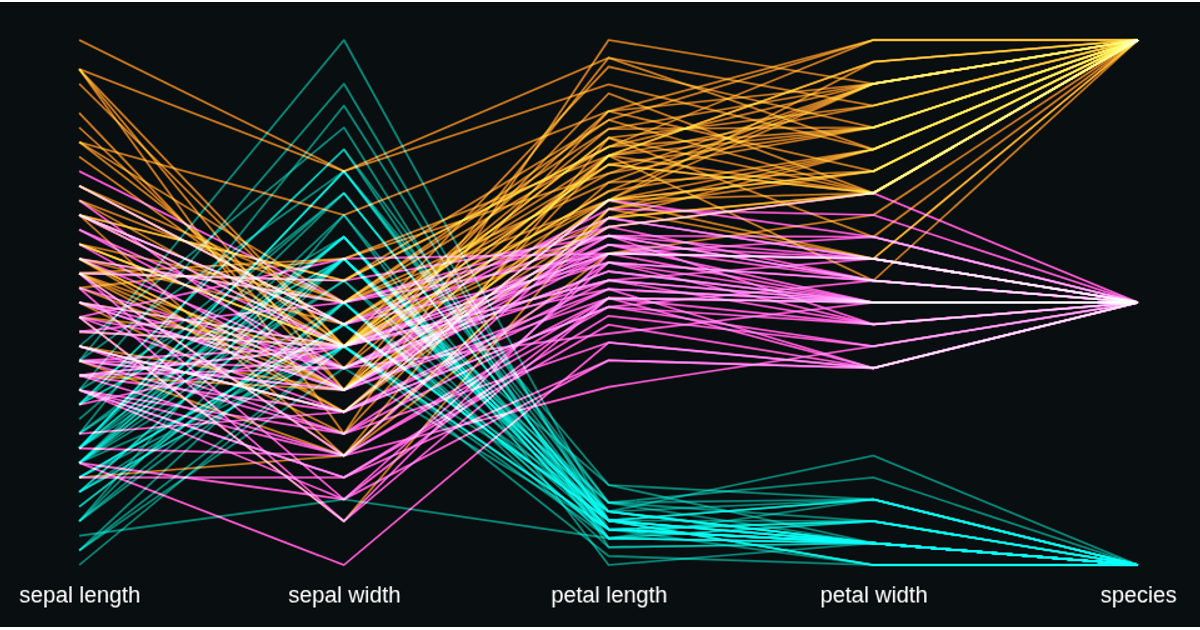
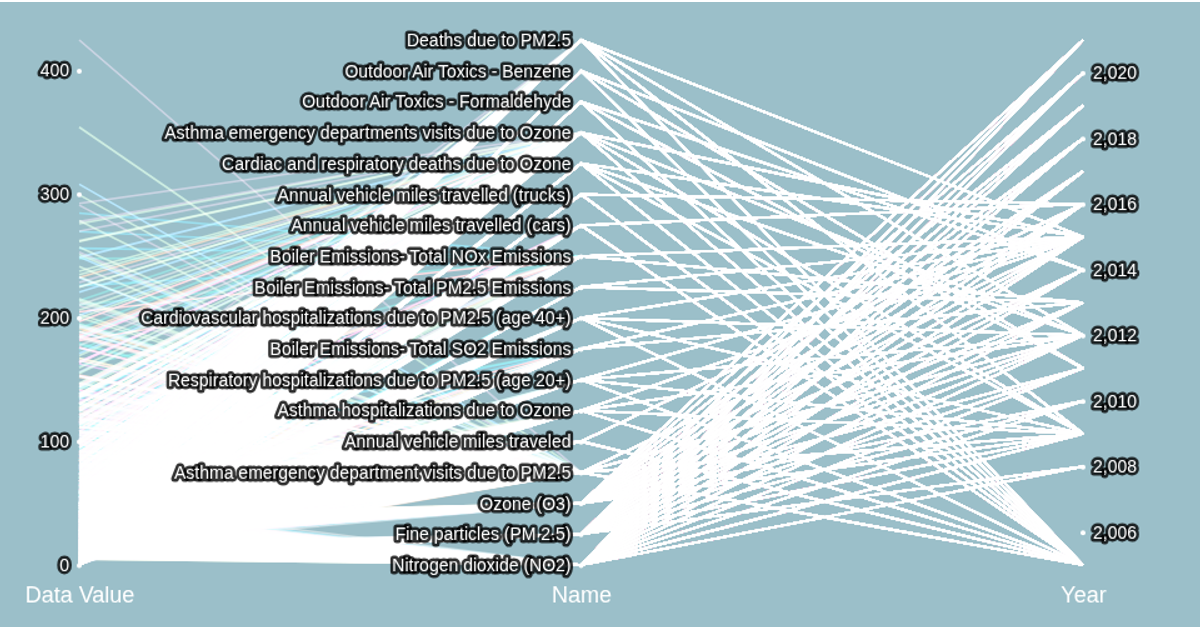
This interactive parallel coordinates plot visualizes a dataset of housing records, encoding five attributes—price, bedrooms, living area, land area, and region—as parallel axes. Each item is represented by a polyline whose color encodes species via an ordinal scale, and strokes use screen blending for visual density. The visualization supports interactive brushing on any axis to filter the data, with smooth opacity transitions animating the marks in and out of the filtered subset.
AI-generated descriptionMIT Licensed





Comments
Sign in to join the discussion.