🌍 Public
Network Graph Diagram with Data
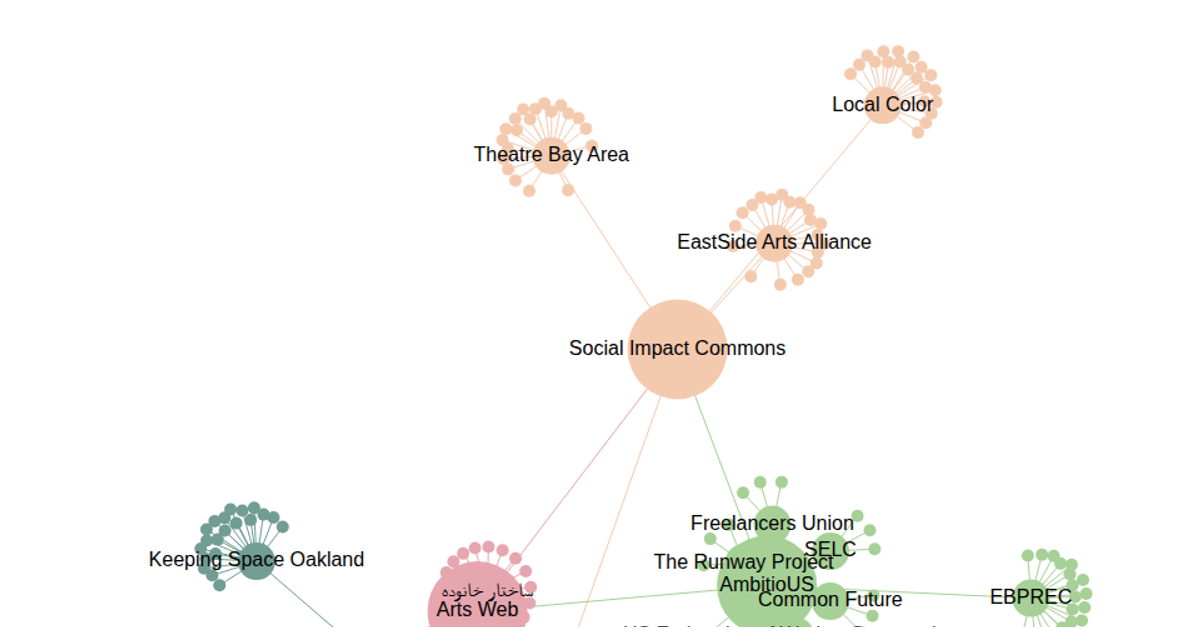
A network graph diagram with data maps interconnected organizations across an arts and community landscape. The visualization shows a hierarchical structure of main nodes, child nodes, and leaf nodes, with larger central hubs like 'Arts Web' and 'Social Impact Commons' branching to smaller affiliated groups. Using d3.forceSimulation with forceManyBody for charge and forceLink for link constraints, the graph dynamically positions nodes in SVG, with circles and text representing each entity. Data comes from a static dataset defining nodes, links, and size distances, rendered in a 960×960 viewport.
AI-generated descriptionMIT Licensed






Comments
Sign in to join the discussion.