🌍 Public
ICE-6 Scatter Plot
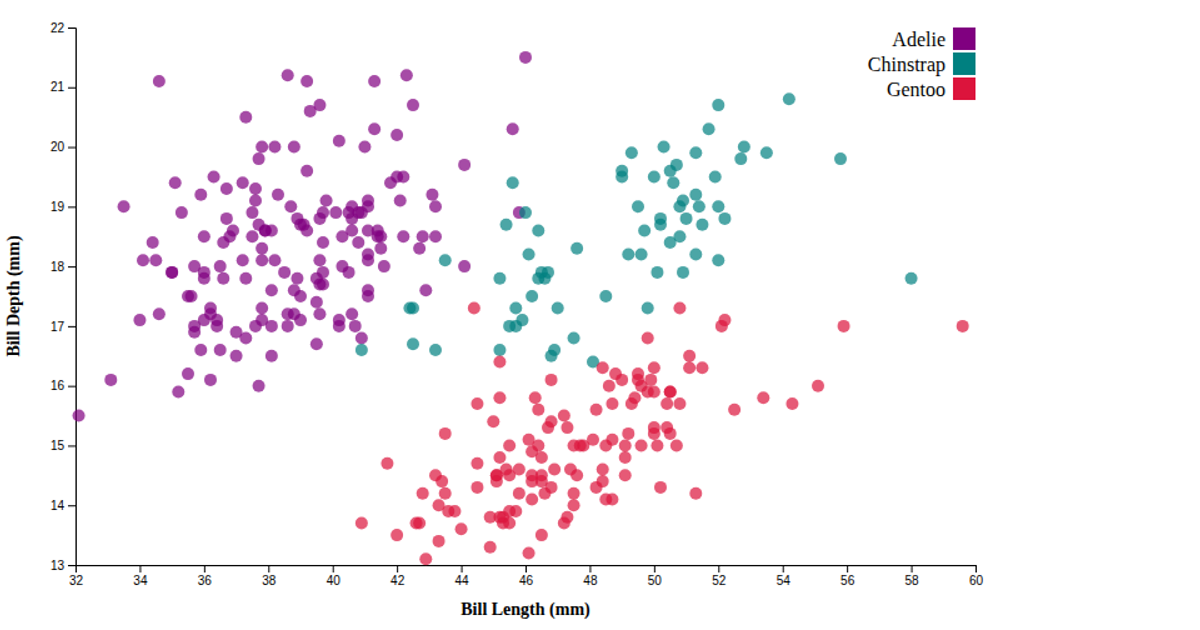
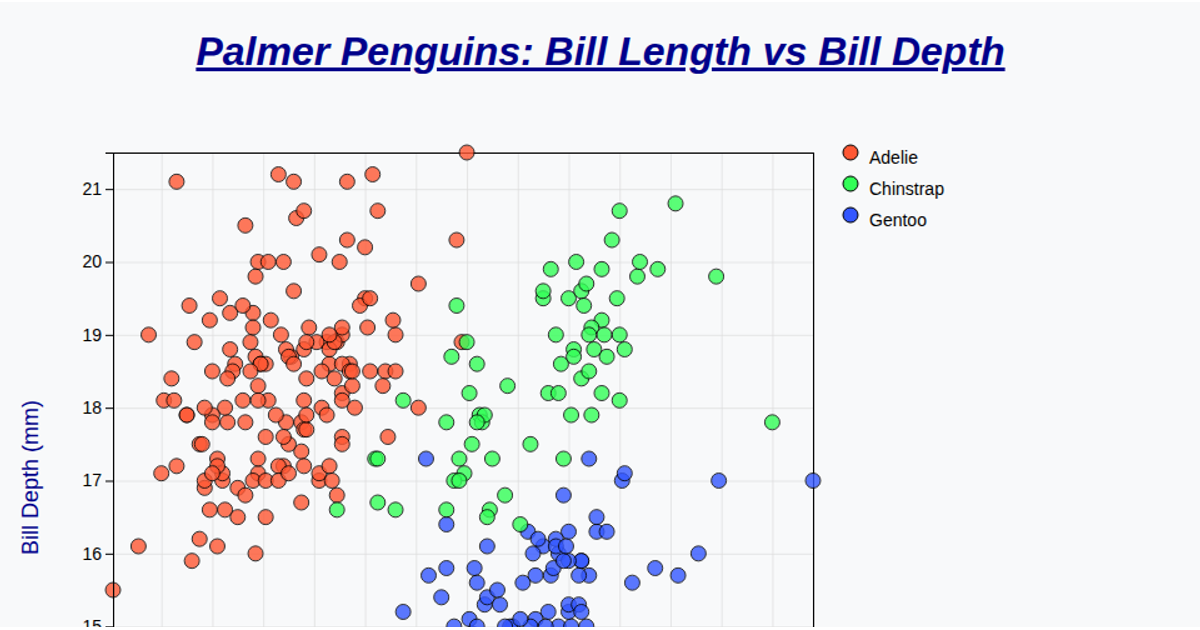
This scatter plot uses D3 v7 to visualize the relationship between bill length and bill depth for Palmer Penguins, with data loaded from the palmerpenguins GitHub repository via `d3.csv` and `d3.autoType`. Points are rendered as SVG circles, colored by species using `d3.scaleOrdinal` with the `d3.schemeSet2` palette, and include interactive tooltips that appear on hover. The chart includes gridlines from `d3.axisLeft`, labeled axes, a title, and a legend, all configured within an SVG canvas.
AI-generated descriptionMIT Licensed






Comments
Sign in to join the discussion.