VP Iteration on First Visual
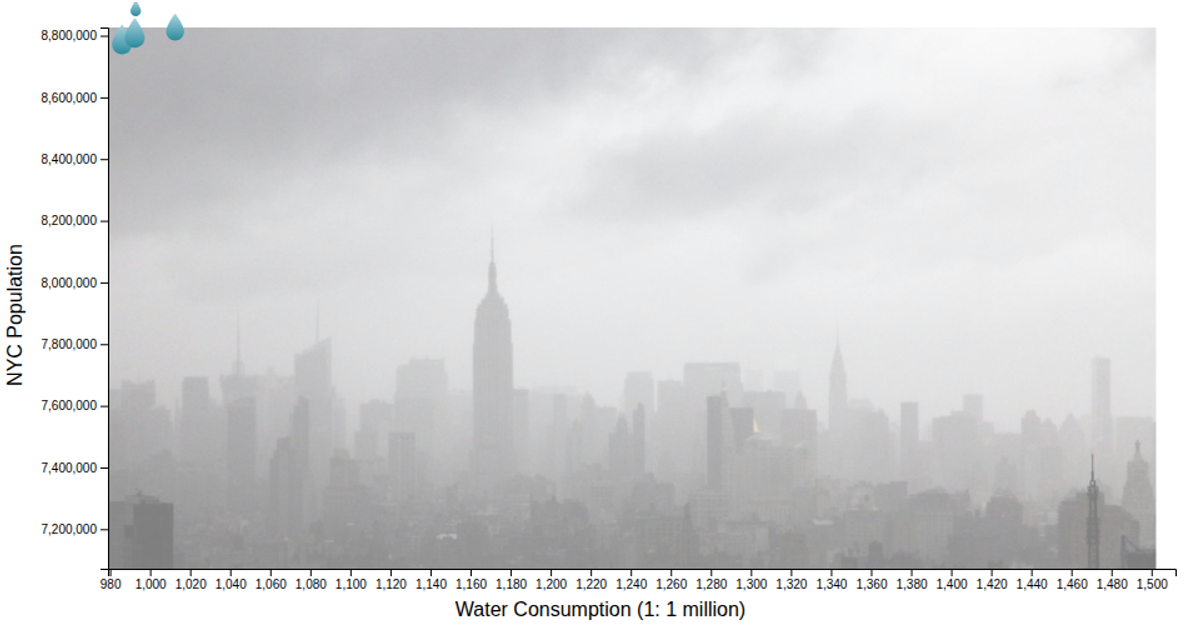
This D3.js visualization displays New York City water consumption and population data from 1979 to 2022. It plots two lines over time: one black line for water consumption (in millions) and one red line for population, each scaled to its own y-axis using `d3.scaleLinear`. The SVG chart is rendered with `d3.line` for the paths, `d3.axisLeft` and axis label helpers from `@curran/axis-labels`, and a light gray inner rectangle background. Data originates from the NYC Open Data water consumption dataset.
AI-generated descriptionA simple scatter plot with D3 showing the Water Consumption in the City of New York Dataset. The X-axis shows the time scale from 1979 to 2022, while the the two lines differ from the Y-Axis. The black line shows the water consumption (in millions) by year, while the red line shows the population in New York City by year.



Comments
Sign in to join the discussion.