🌍 Public
TOP 10 MOST POPOLOUS CITIES
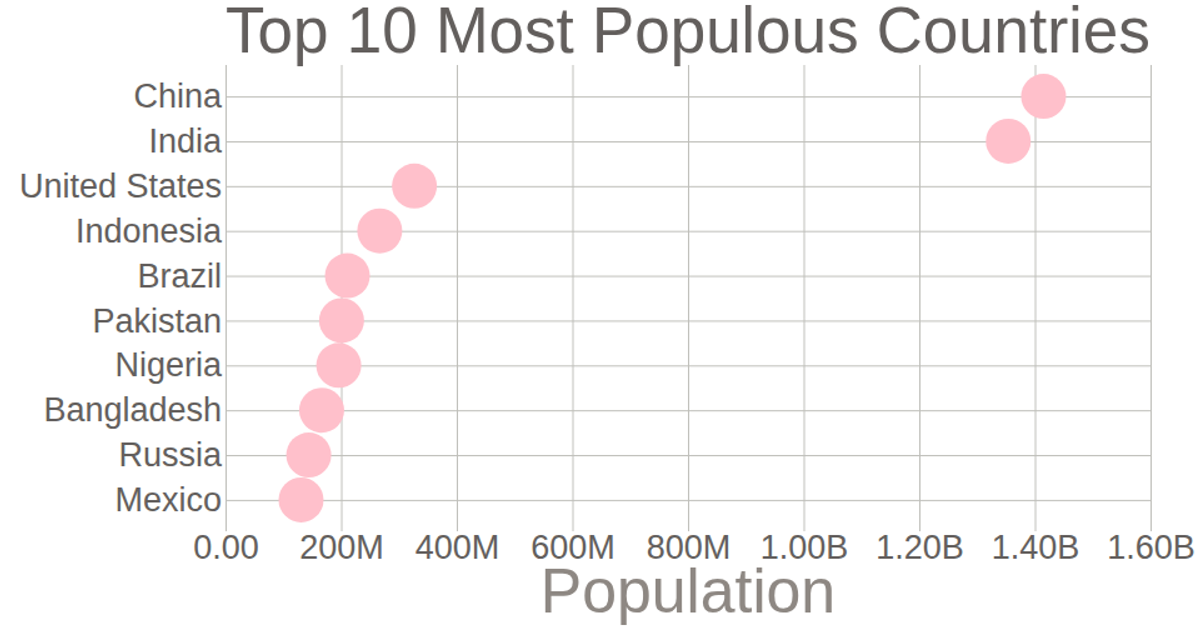
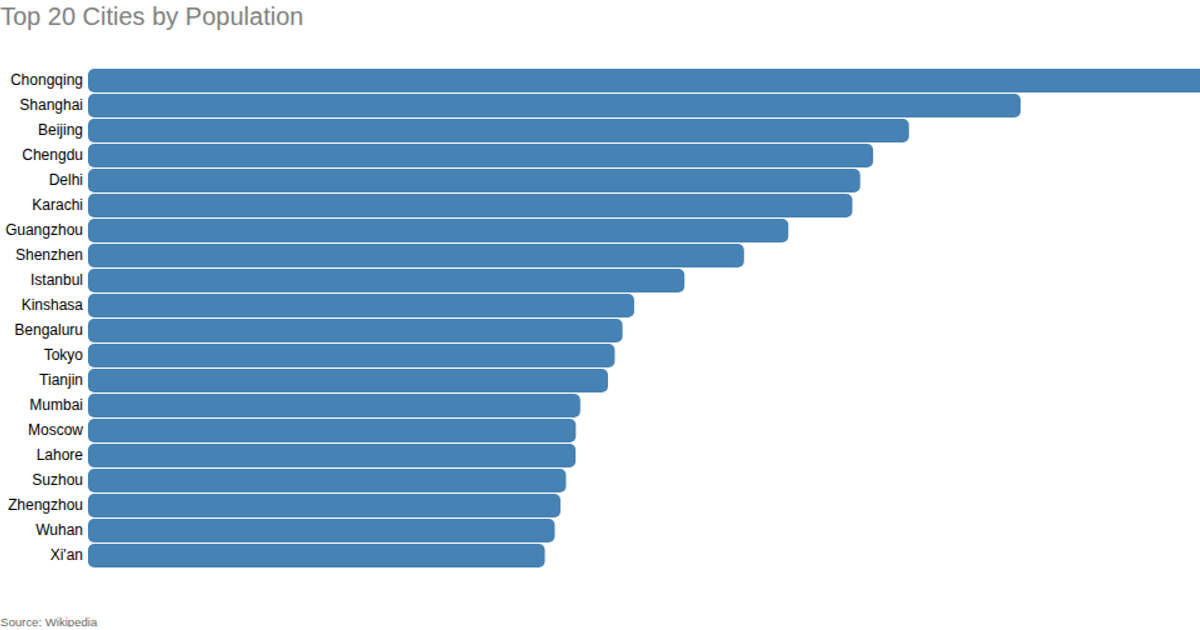
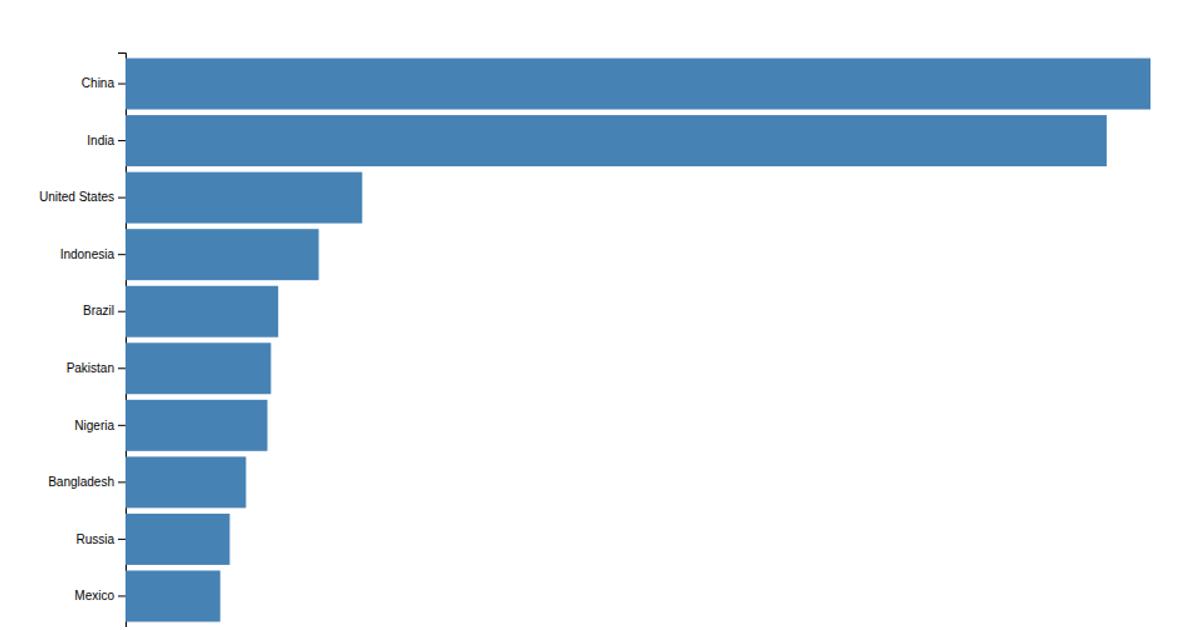
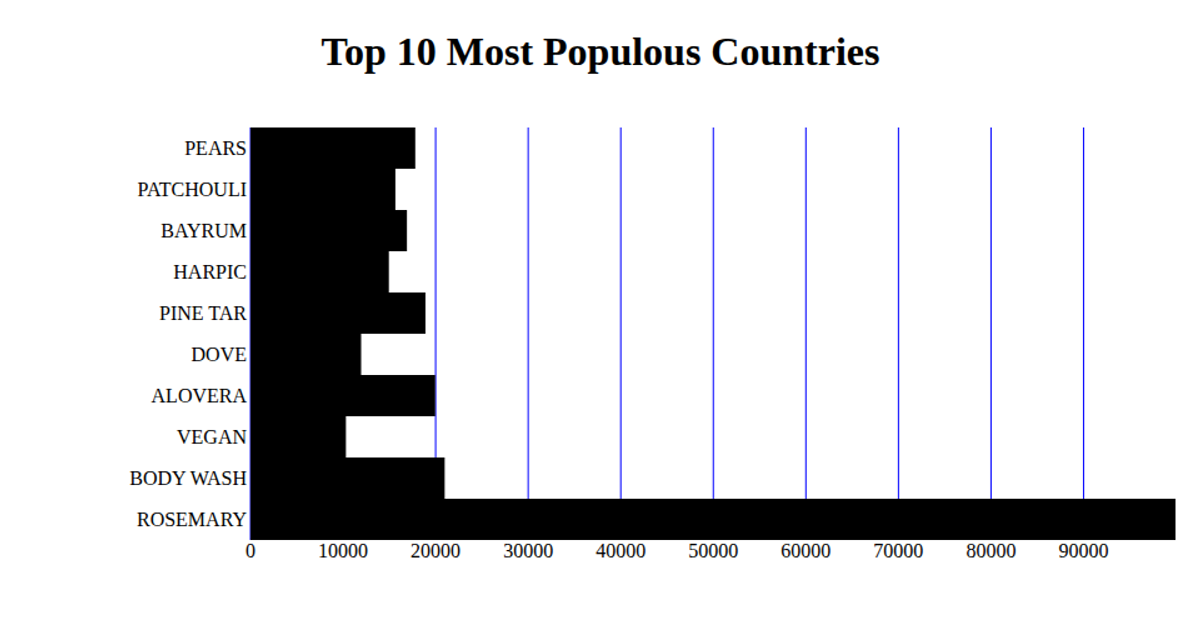
This visualization displays the ten most populous cities in Australia, using a horizontal bar chart rendered as SVG. The bars are styled with solid red fills and the city names are labeled with large text. The chart is built using the D3.js library (version 5), with data loaded from a local CSV file (`aust.csv`) containing city names and their respective populations. The program reads the data asynchronously using the `csv` function, and the SVG canvas is set to 960 by 500 pixels.
AI-generated descriptionMIT Licensed




Comments
Sign in to join the discussion.