🌍 Public
There I can change the title
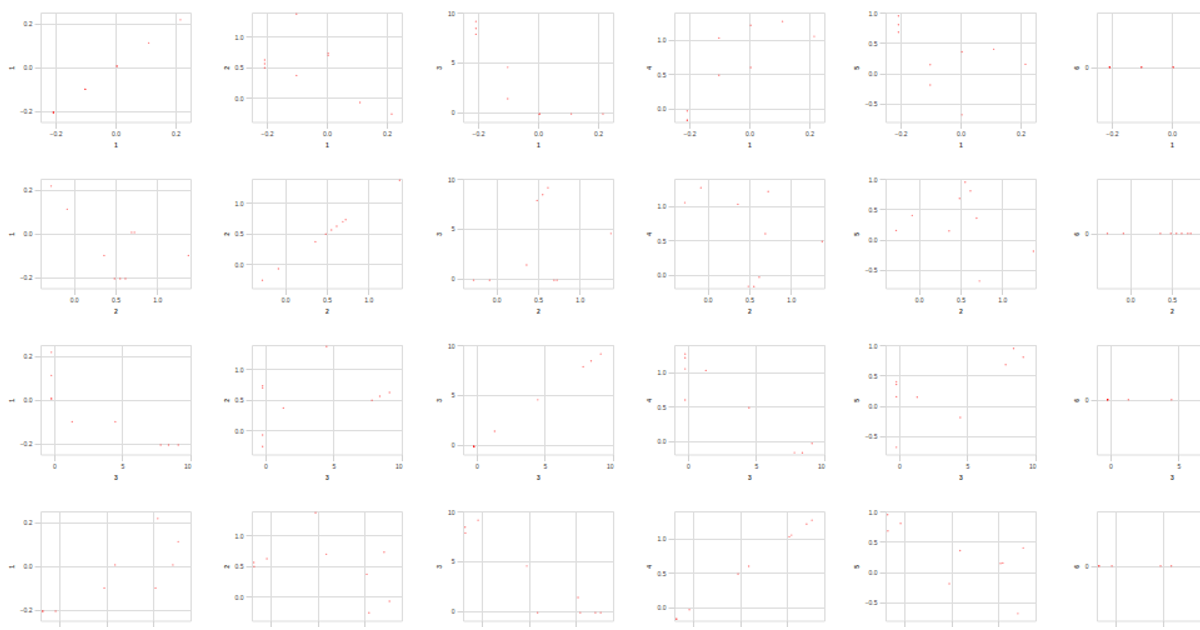
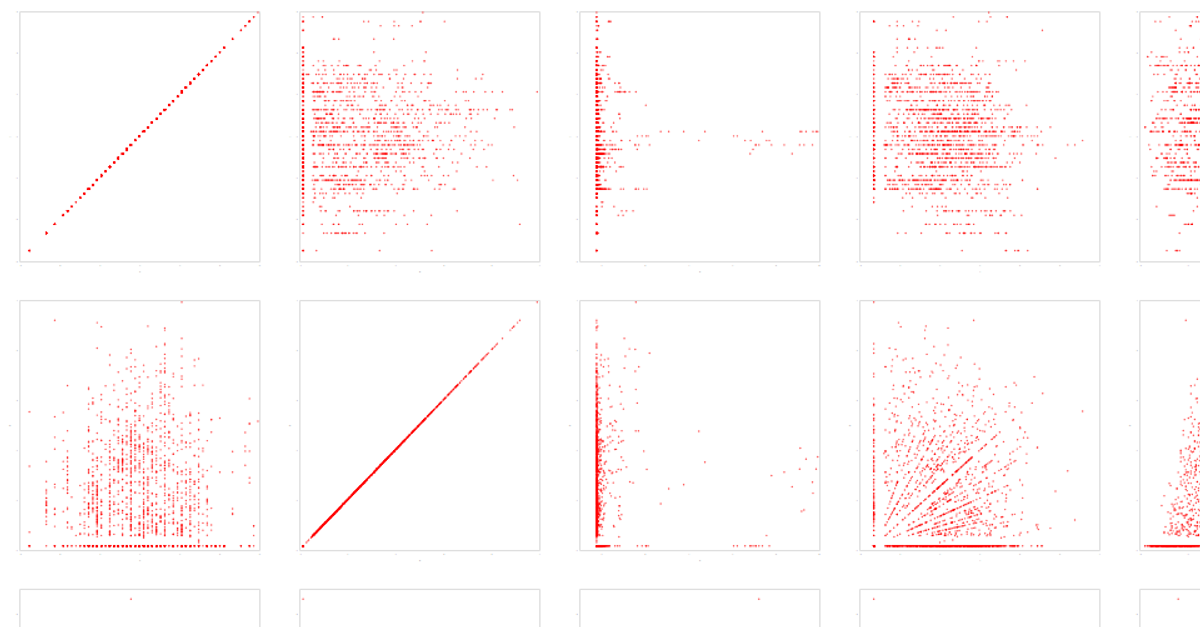
This gallery example displays a scatter plot matrix of the Auto MPG dataset, sourced from the UCI Machine Learning Repository. The visualization repeats columns and rows to show pairwise relationships among 12 numeric attributes, with each point colored by an outlier field. Built with the Vega-Lite API and D3, the chart uses panzoom for zooming and interactive selection: pressing Ctrl and clicking points highlights them in red. The custom configuration adjusts axis and label styling for a minimal, dark-themed appearance.
AI-generated descriptionA visualization constructed using the vega-lite-api.
The data shown here comes from the UCI Machine Learning Repository: Auto MPG Data Set, via Gist: Scatter Plot with Menus.
MIT Licensed



Comments
Sign in to join the discussion.