🌍 Public
Retail Sales Bar Chart
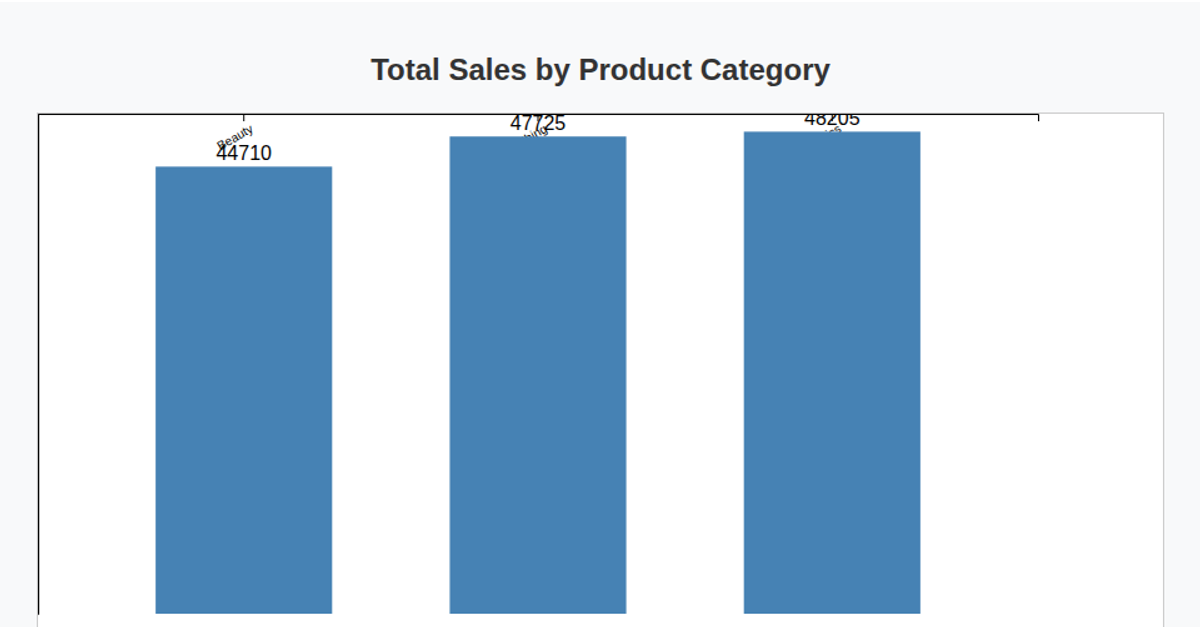
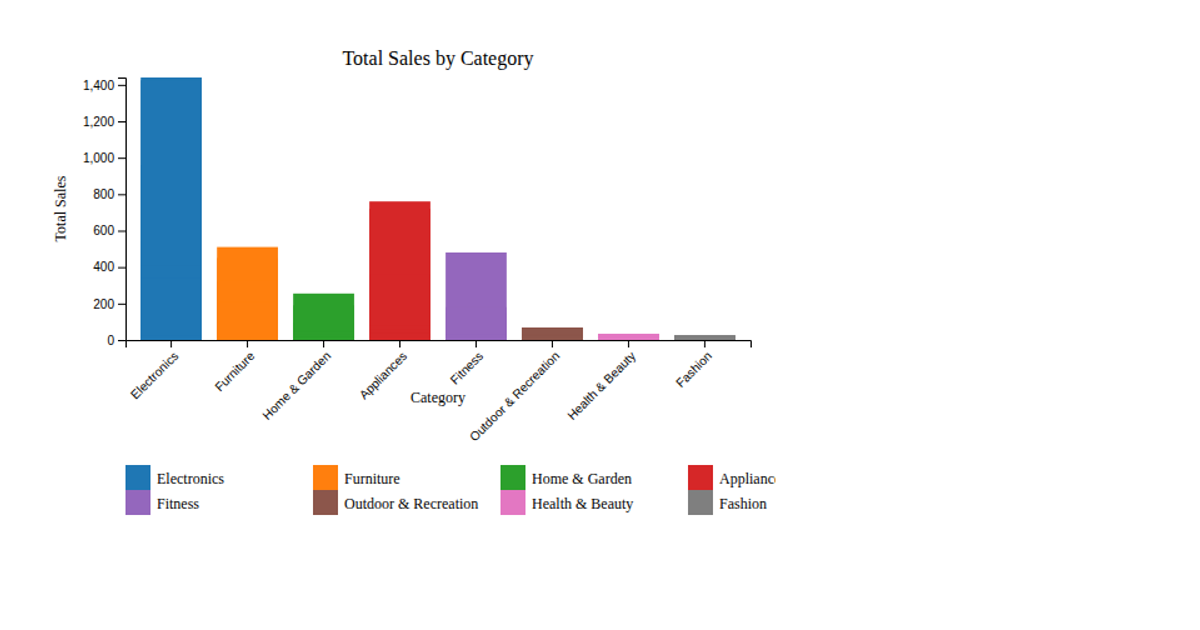
This bar chart displays total retail sales by product category, from a CSV dataset that is grouped and summed with `d3.rollups` and `d3.sum`. The top ten categories are sorted descending and rendered as steel-blue rectangles using an SVG `scaleBand` and `scaleLinear`. Axis labels are rotated via `d3.axisBottom`, and the chart includes a title and y-axis gridlines generated with `d3.axisLeft`.
AI-generated descriptionMIT Licensed





Comments
Sign in to join the discussion.