🌍 Public
Heart rate
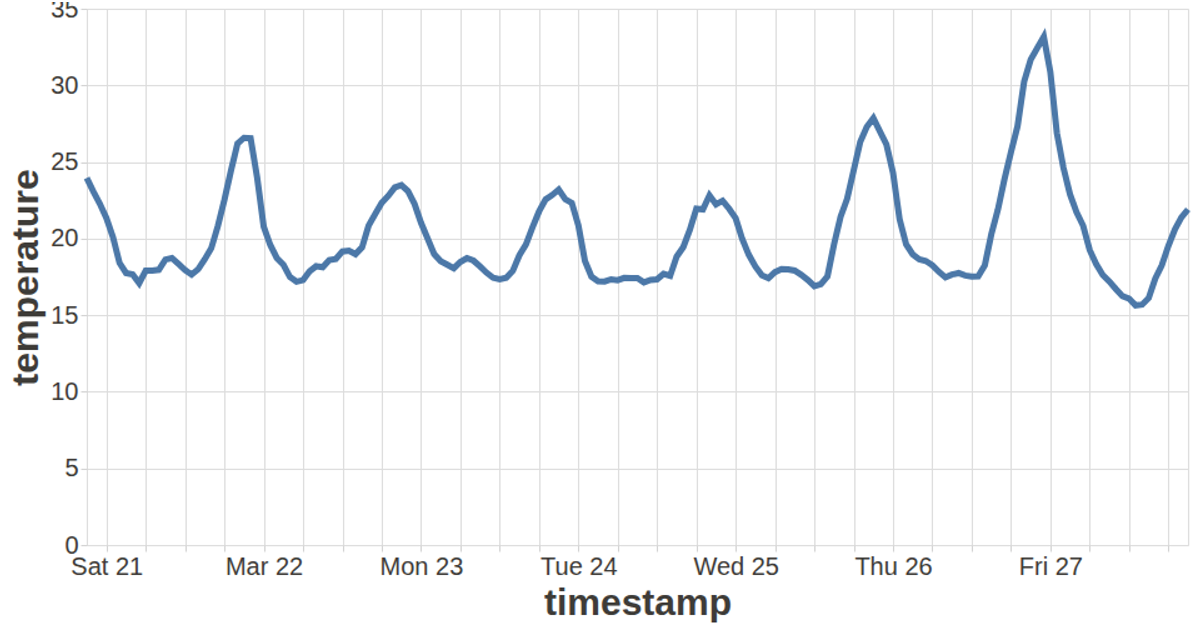
A line chart shows heart rate over time, with time on the x-axis and heart rate values on the y-axis. The visualization uses Vega-Lite’s `line` mark, encoding a temporal field for x and a quantitative field for y. Data is loaded from a remote CSV file via a URL in the Vega-Lite specification. The chart is rendered in the browser using Vega-Embed, which loads the specification and displays the resulting visualization. The chart is set to a fixed width of 360 pixels.
AI-generated descriptionMIT Licensed




Comments
Sign in to join the discussion.