🌍 Public
Wykres Słupkowy
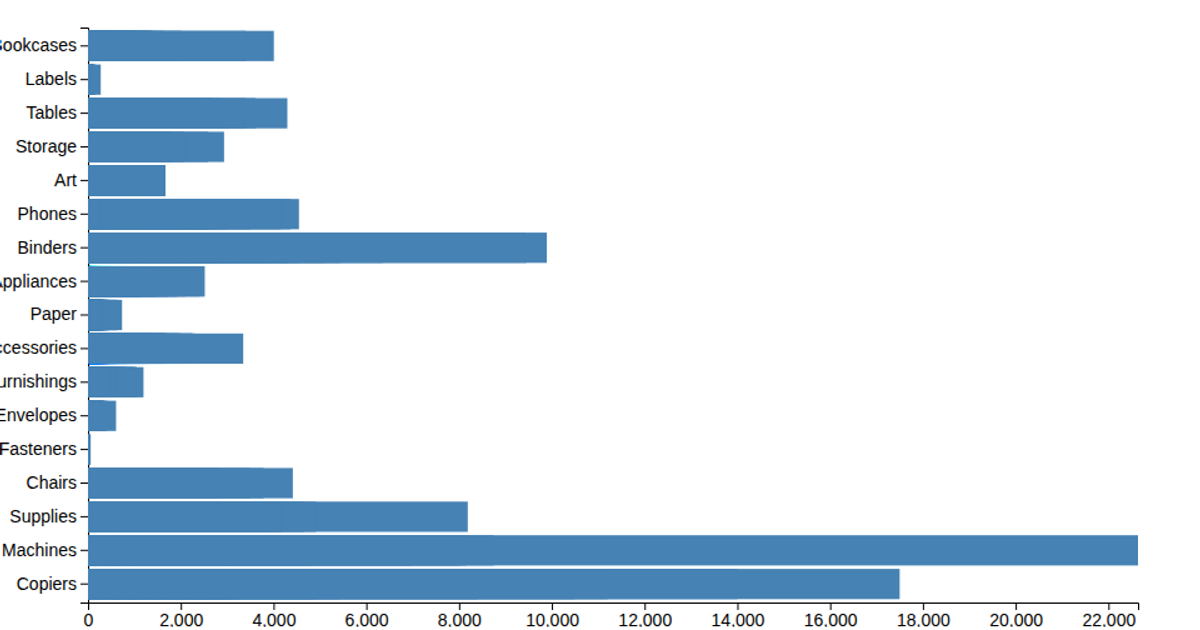
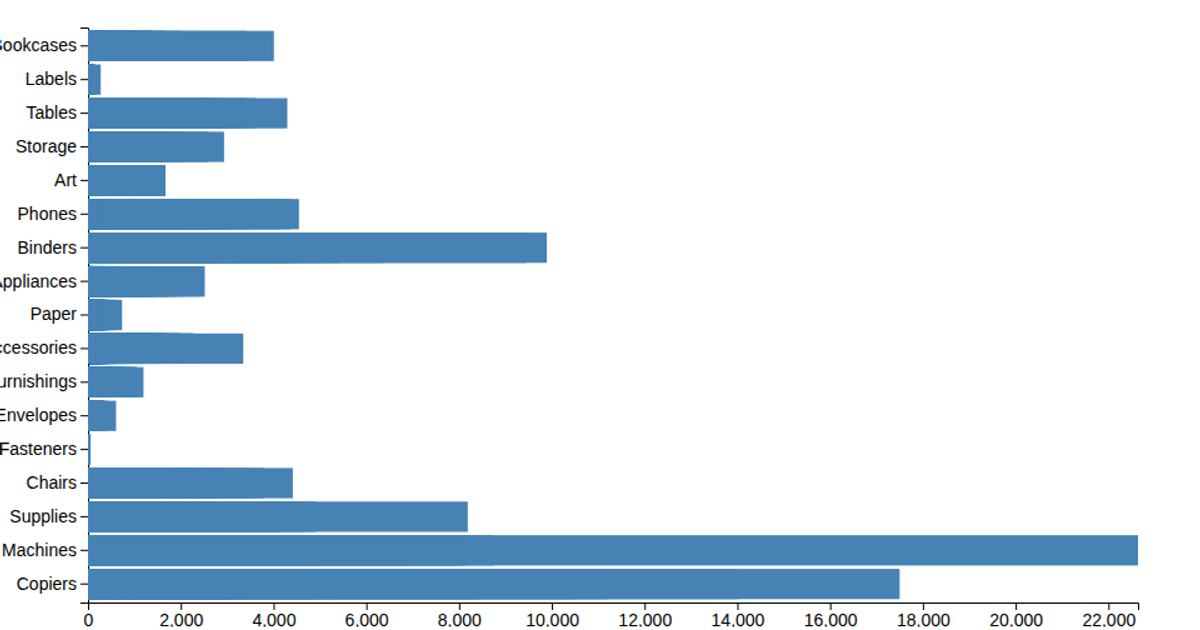
This example presents a bar chart depicting product sales across five categories, labeled as Kategoria A through E. The chart renders sales values as steelblue bars within an SVG container, with axes and value labels. The visualization uses D3 version 7, applying the `d3.scaleBand` and `d3.scaleLinear` for axis mapping, and `d3.axisBottom` and `d3.axisLeft` for rendering the axes. Data is hardcoded in the script and displayed using D3's selection and `.enter()` methods.
AI-generated descriptionA demonstration of how to start using D3 version 6.
MIT Licensed




Comments
Sign in to join the discussion.