🌍 Public
Task3.2 of Activity6
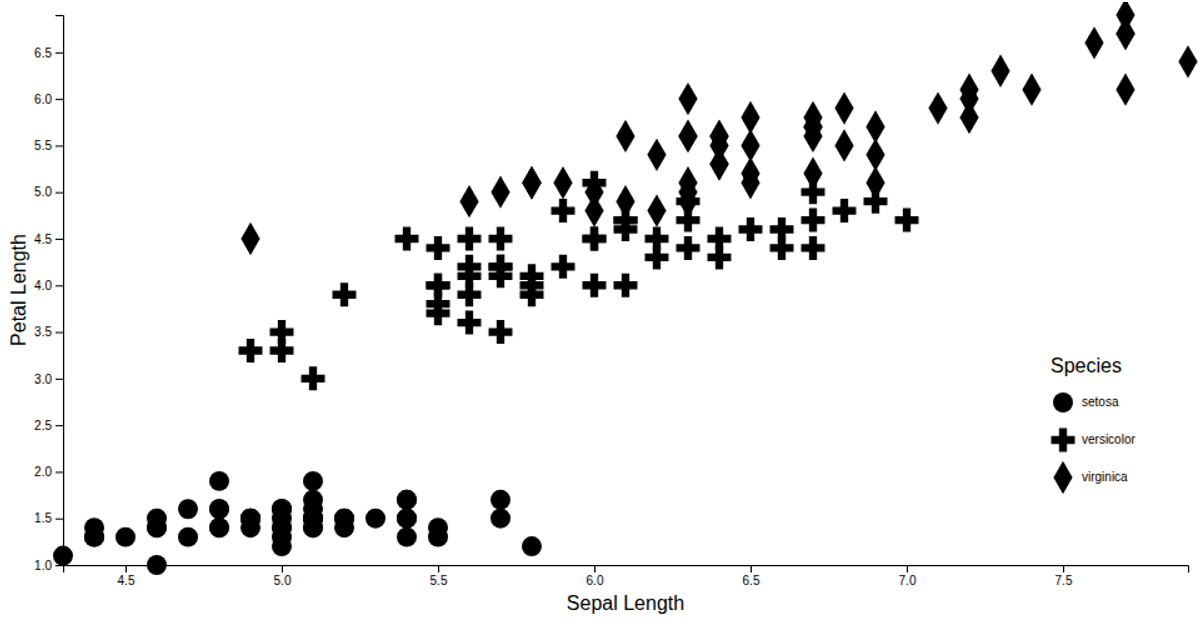
This example displays the Iris dataset as an interactive scatter plot, mapping sepal length to the x-axis and petal length to the y-axis. Different species are encoded through distinct shapes using D3’s `symbol` generator and `scaleOrdinal` with `symbolsFill`, with a custom legend indicating the shape meanings. The visualization is built with D3 v7, using modular functions for axes and legends, and loads the data asynchronously from a GitHub-hosted CSV file.
AI-generated descriptionMIT Licensed



Comments
Sign in to join the discussion.