🌍 Public
NFL Touchdowns vs. Interceptions Scatter Plot
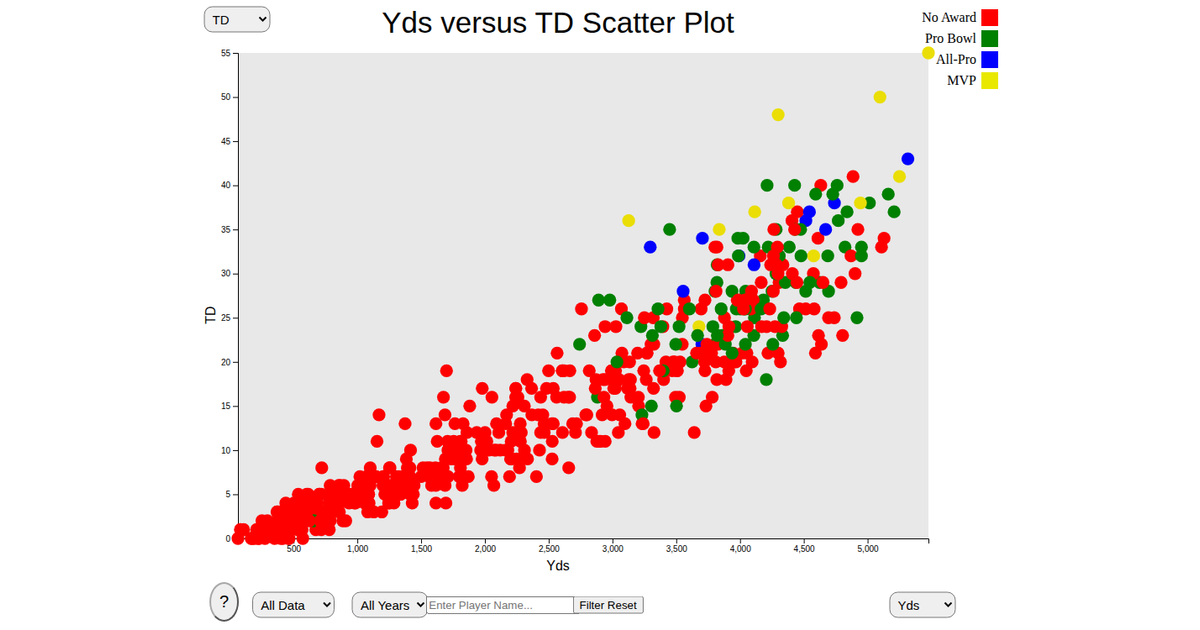
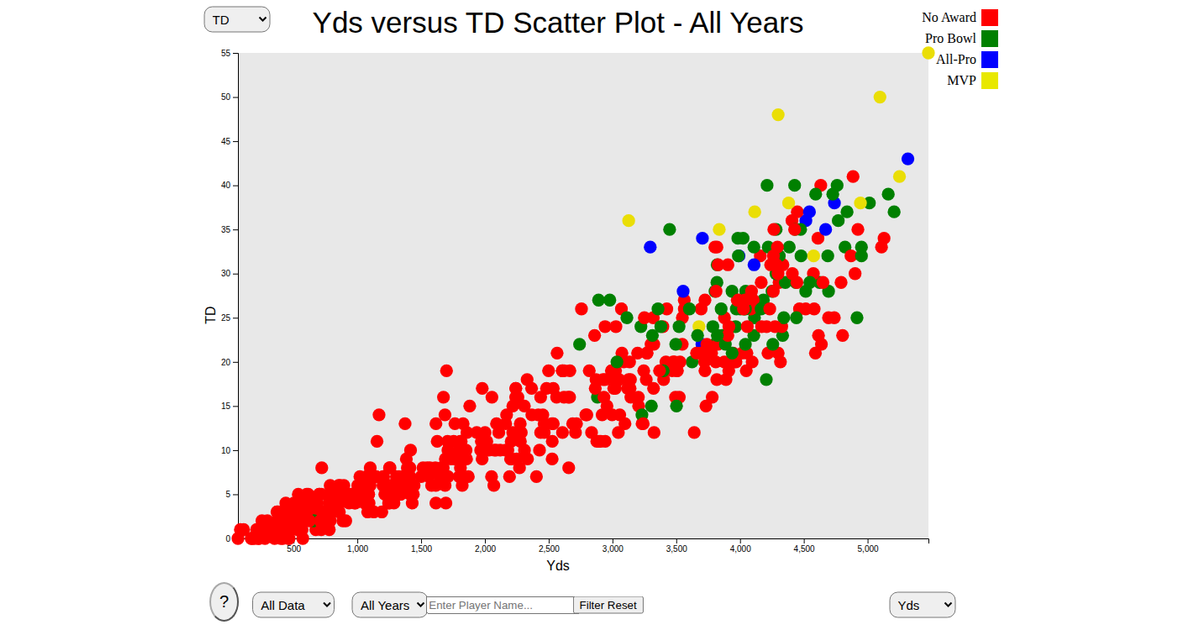
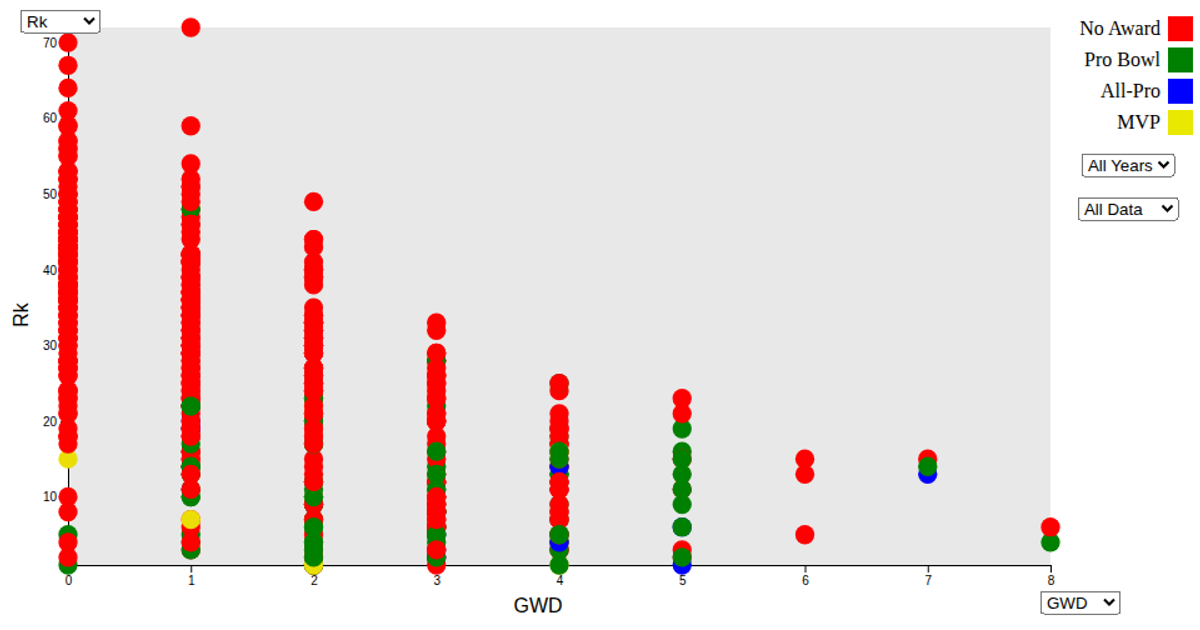
This scatter plot visualizes the relationship between NFL passing touchdowns and interceptions for quarterbacks in the 2023 season, with each circle representing a player. The chart positions interceptions on the x-axis and touchdowns on the y-axis, using linear scales to map the data. Built with D3.js, the visualization employs `scaleLinear` for both axes and renders circles with a fixed radius and opacity, overlaid on a light gray inner rectangle. Axis labels are added using the `@curran/axis-labels` package, while the underlying dataset comes from the `@SamKarkache/nfl-passing-yards-2023` package. The code calculates axis domains from the data's extent and includes margin-based positioning for the plot area.
AI-generated descriptionMIT Licensed



Comments
Sign in to join the discussion.