🌍 Public
proj-choropleth
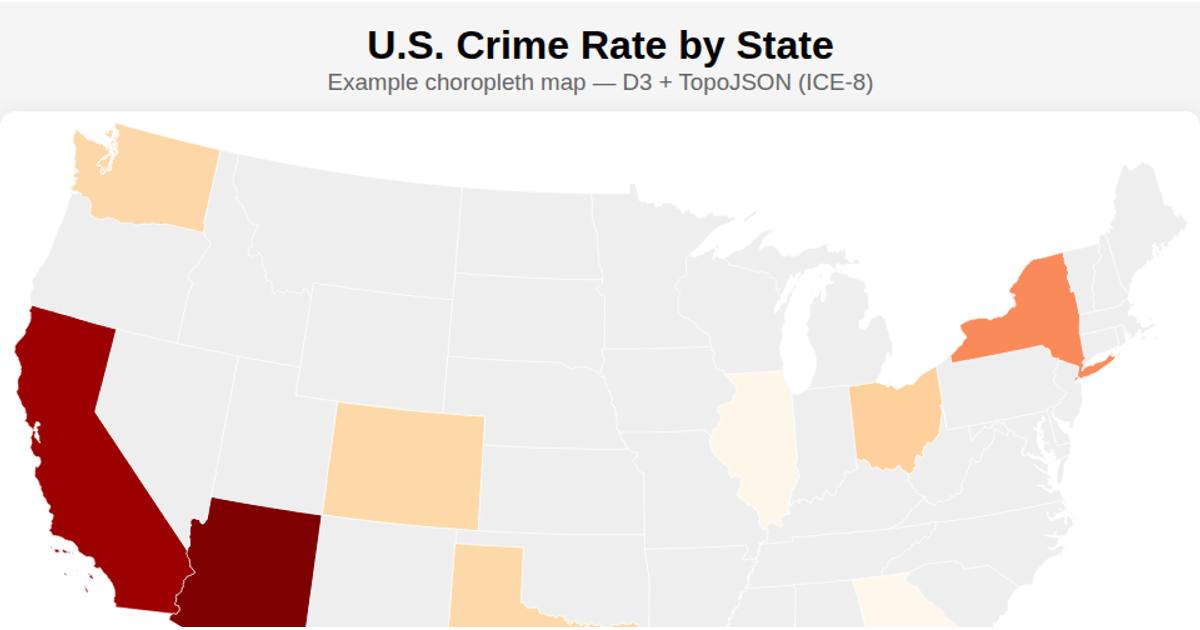
This visualization animates through daily snapshots of reported crime counts across Chicago’s community areas. A sequential blue color scale, created with `d3.scaleSequential`, encodes each area’s crime total for the current date. Using `d3.geoMercator` and `d3.geoPath`, the example renders SVG paths from a GeoJSON file of community boundaries, with a transitioning fill color per area via `transition.attr`. The code loads crime data from a JSON file and updates the map as it cycles through available dates.
AI-generated descriptionThis is for troubleshooting :)
MIT Licensed



Comments
Sign in to join the discussion.