🌍 Public
Activity-8_task-3.2
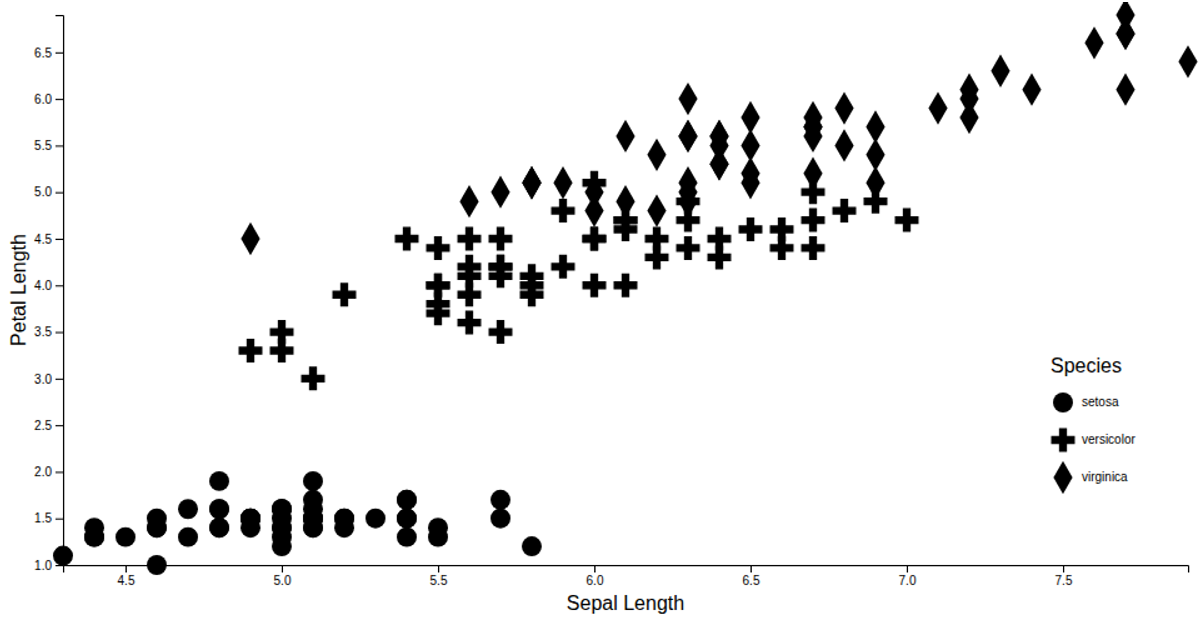
This example displays an interactive scatter plot of the Iris dataset, showing sepal length against petal length with species encoded by marker shape. It uses D3 v7 modules including `scaleLinear`, `scaleOrdinal`, `extent`, and `symbol` for custom shape legends. The code loads data asynchronously from a CSV hosted on GitHub, parses it with `csvParse`, and renders axes and marks via reusable ES6 modules. A categorical legend maps species names to distinct symbols using `symbolsFill`.
AI-generated descriptionAn example showing the capabilities of VizHub:
- Loads D3 via UNPKG.
- Demonstrates use of
importfrom"d3". - Demonstrates use of
importfrom local ES6 modules.
MIT Licensed




Comments
Sign in to join the discussion.