🌍 Public
Exercise8_Tutorial4
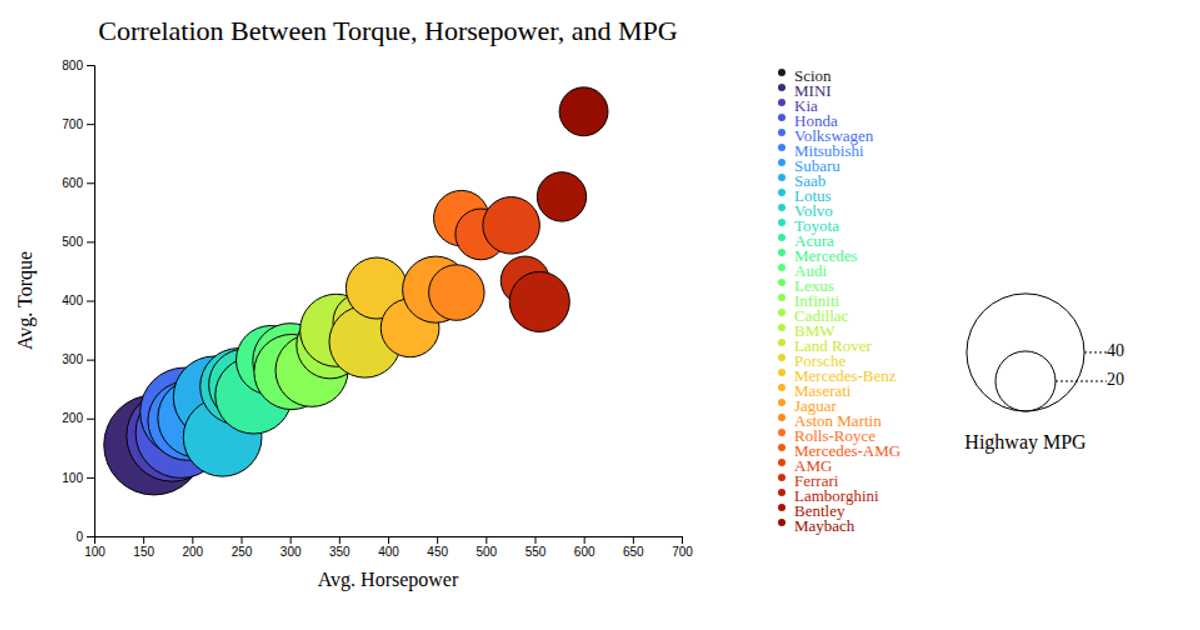
This bubble chart visualizes the correlation between average horsepower (x-axis), torque (y-axis), and highway MPG (bubble size and color) across 31 car makes. Using d3.csv to load data, the chart renders SVG circles scaled by a linear d3.scaleLinear for size, with an ordinal color scale applying d3.interpolateTurbo. Interactive tooltips appear on mouseover, while a legend shows MPG value ranges and make colors.
AI-generated descriptionMIT Licensed



Comments
Sign in to join the discussion.