🌍 Public
K_Task_4
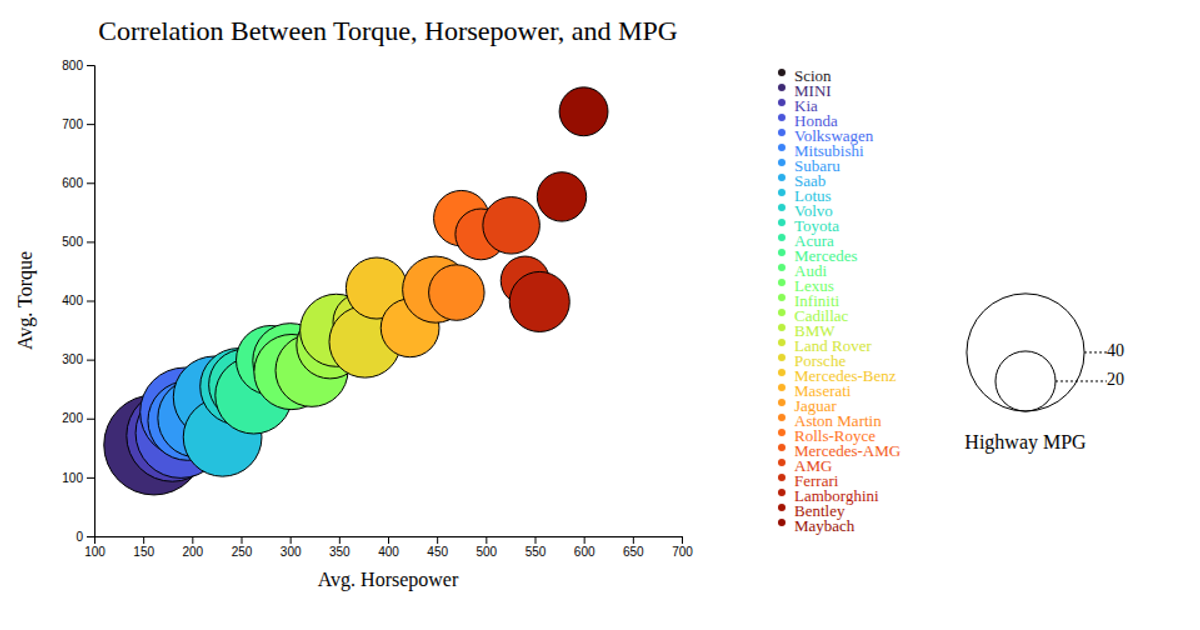
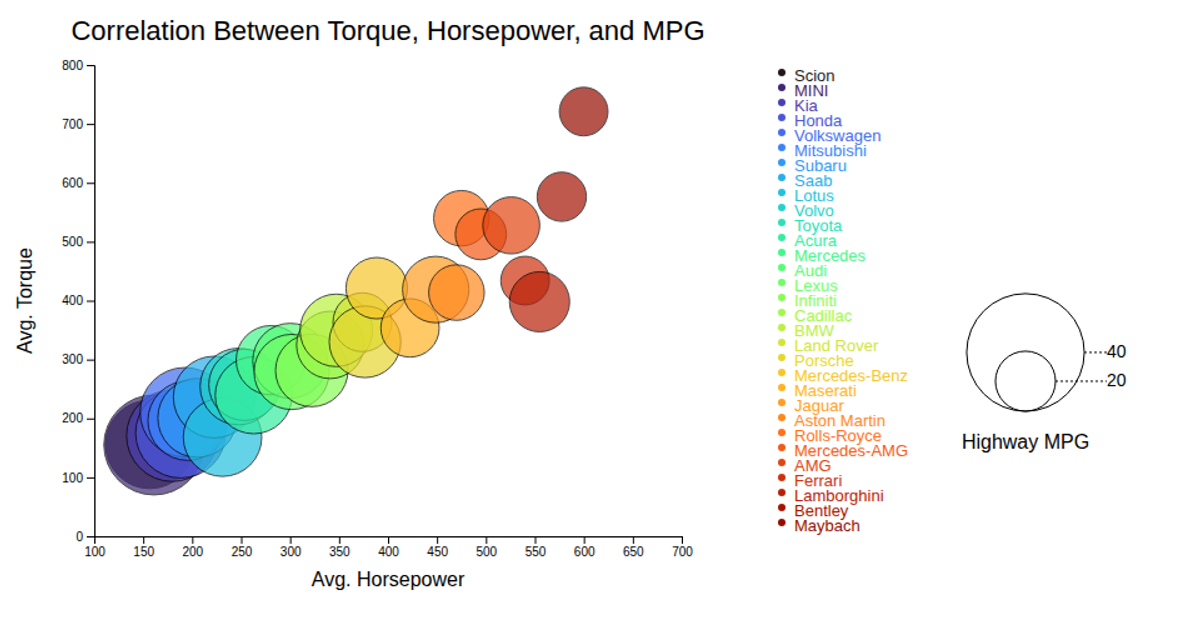
This bubble chart visualizes the relationship between average horsepower and torque for various car makes, with bubble size encoding highway MPG and color distinguishing make. Data is loaded from a CSV file and rendered as SVG circles using D3.js (v6) with linear scales for both axes. Interactive tooltips appear on mouseover, and a legend displays the bubble size scale and color categories. The chart also includes axis labels and a title to clarify the plotted metrics.
AI-generated descriptionMIT Licensed



Comments
Sign in to join the discussion.