🌍 Public
Que1
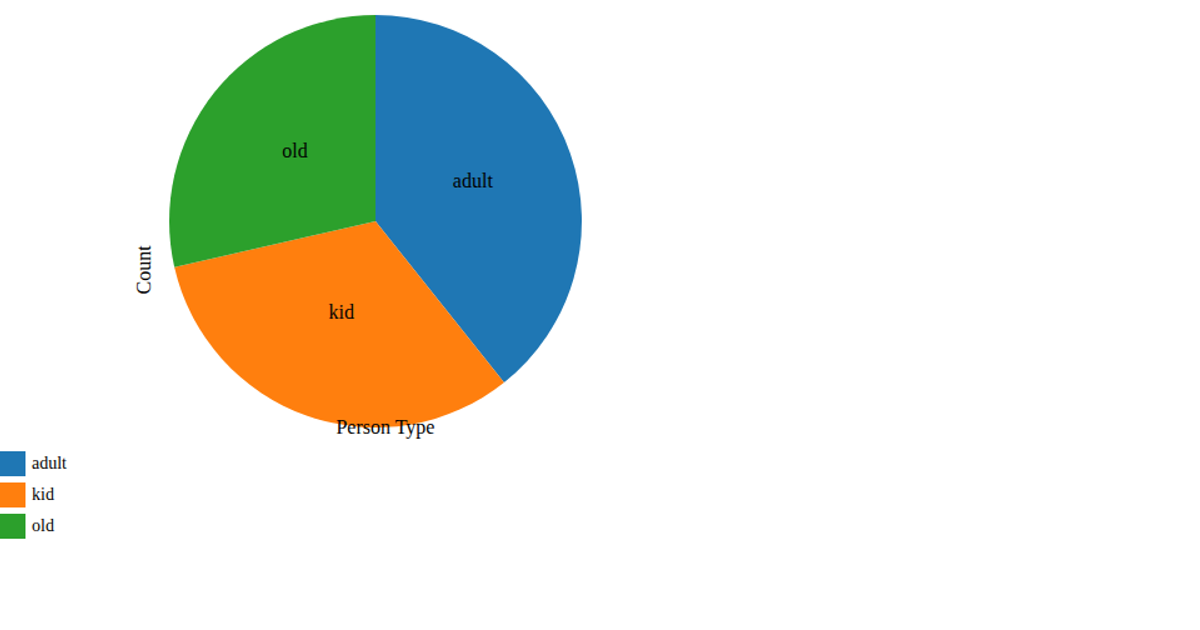
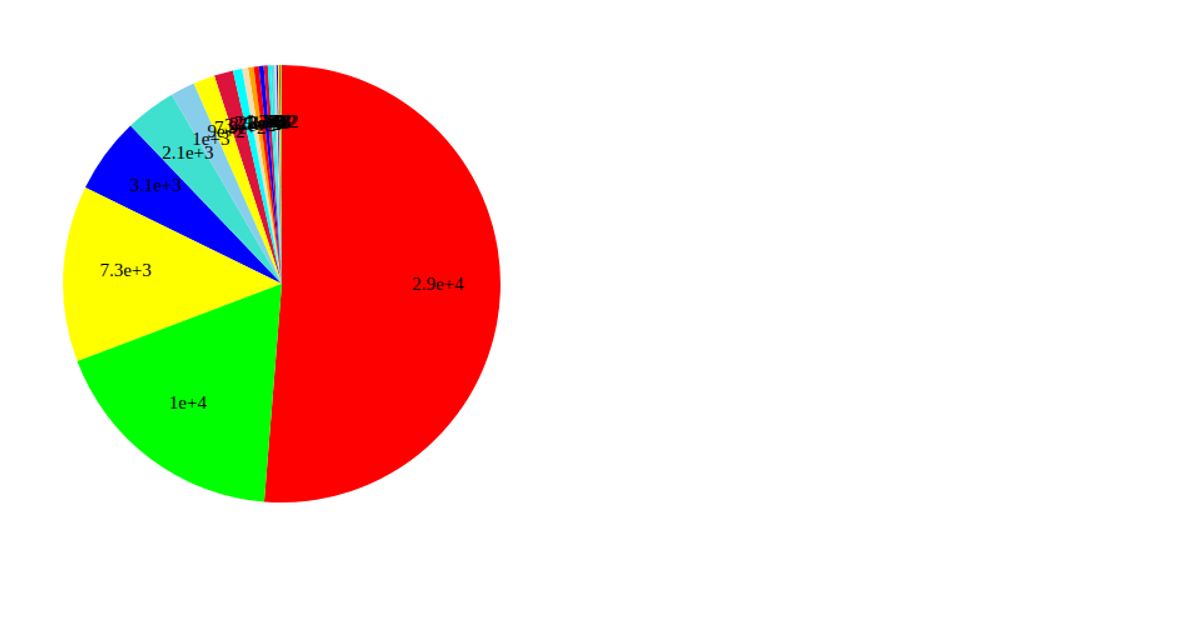
This example shows a pie chart visualizing survival data from a CSV file, with each slice labeled by passenger ID and a corresponding legend. The chart is rendered as an SVG using D3 v7, employing `d3.pie` to compute arc angles and `d3.arc` to generate the path shapes. Slices are colored with `d3.scaleOrdinal` and `d3.schemeCategory10`, with labels positioned at each arc’s centroid. Data is loaded asynchronously via `d3.csv` from a remote GitHub gist.
AI-generated descriptionA demonstration of pie chart.
MIT Licensed



Comments
Sign in to join the discussion.