🌍 Public
Treemap from bl.ocks.org
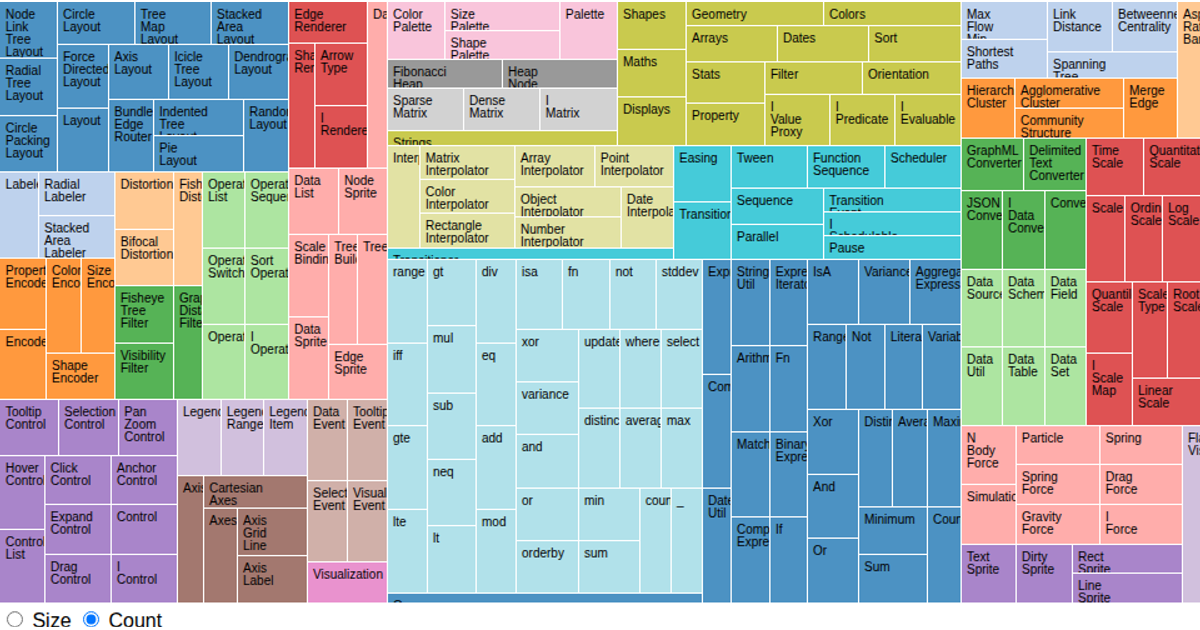
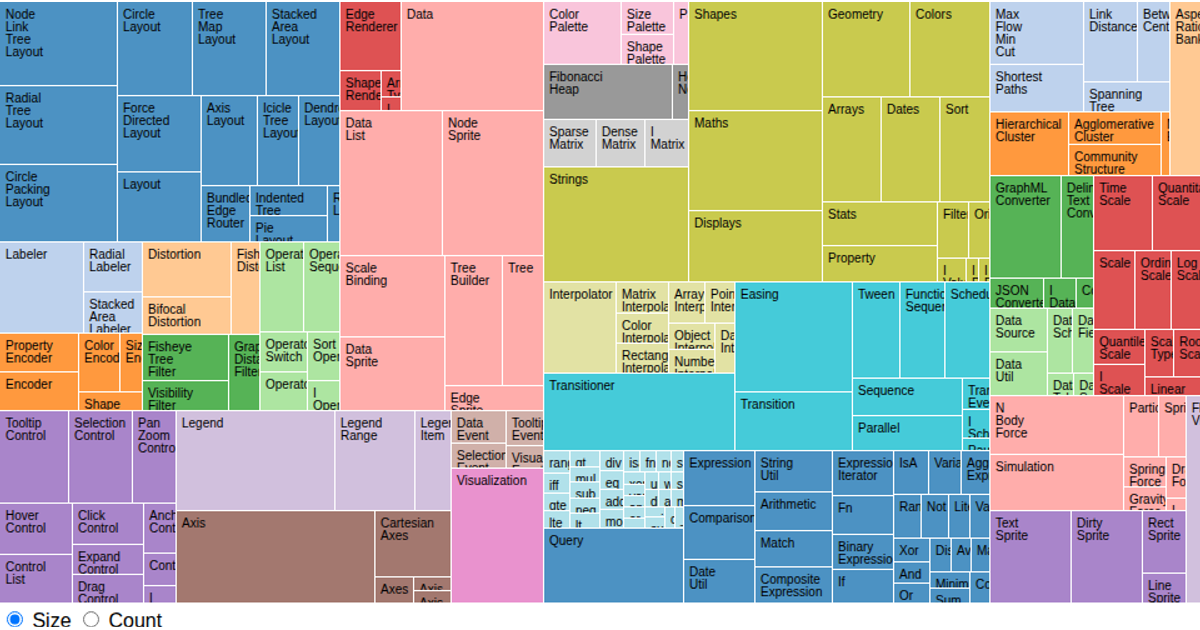
This interactive treemap visualizes a hierarchical dataset representing two academic semesters, with courses nested within periods. The treemap uses animated rectangles whose sizes reflect either the sum of course credits or the count of courses within each category, toggleable via radio buttons. Built with D3 v4’s `d3.treemap` and `d3.hierarchy`, the SVG rendering includes labels with clipping paths and color-coded tiles. Data loads from `flare.json`, and transitions animate layout changes via the `transition()` method.
AI-generated descriptionAn example of porting a work from bl.ocks.org into VizHub. This is a direct port of Mike Bostock’s Block: Treemap, modified only to split into separate files, and to fit in the space available.
MIT Licensed




Comments
Sign in to join the discussion.