activity 6 task_2
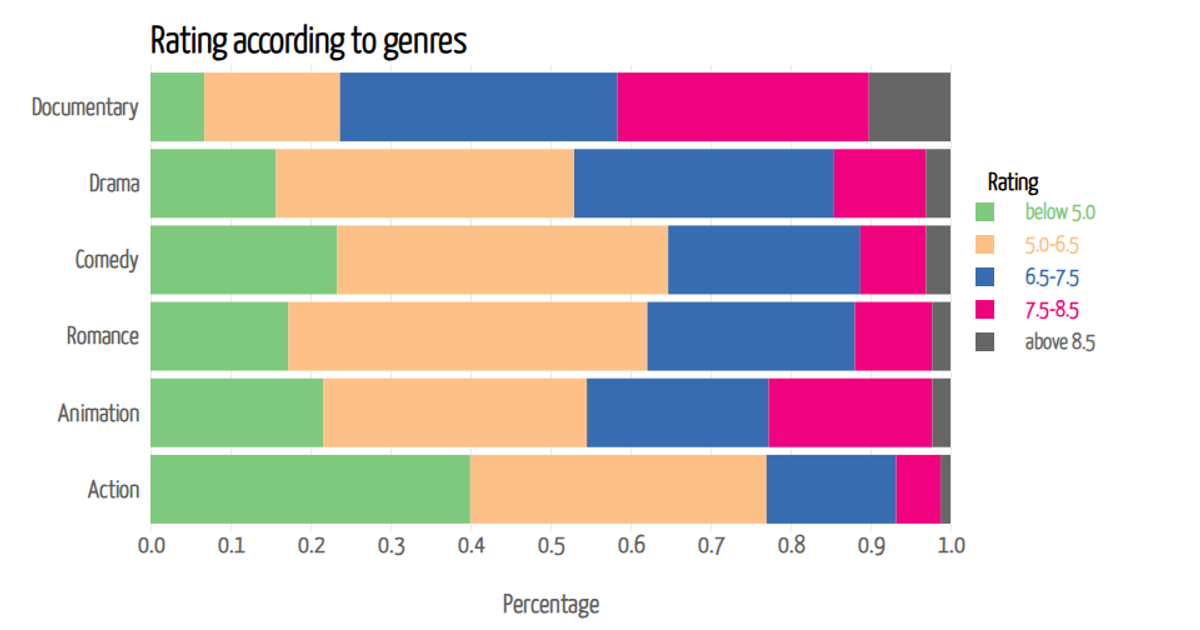
This stacked bar chart shows the distribution of IMDb movie ratings across genres, with each bar segment representing the proportion of films in rating categories from "below 5.0" to "above 8.5." Hovering over a segment displays a tooltip with the exact percentage for that genre and rating level. Built with D3 v7, the visualization uses `d3.stack`, `d3.scaleOrdinal`, and `d3.axisLeft` to render the SVG, reading data from a CSV file. Mouse interactions trigger opacity changes and tooltip updates via D3's event handlers.
AI-generated descriptionThe impact of genre on movie ratings
This stacked bar chart gives the percentage of each rating level within different movie genres. The aim is to show the impact of genre on movie ratings. When the mouse hovers over each bar, you can see pop-ups of accurate percentage of each rating level within each genre. Total percentage is 1, representing 100%.




Comments
Sign in to join the discussion.