🌍 Public
Fork of 6 weeks Covid-19 cases of 3 Counties, Ohio
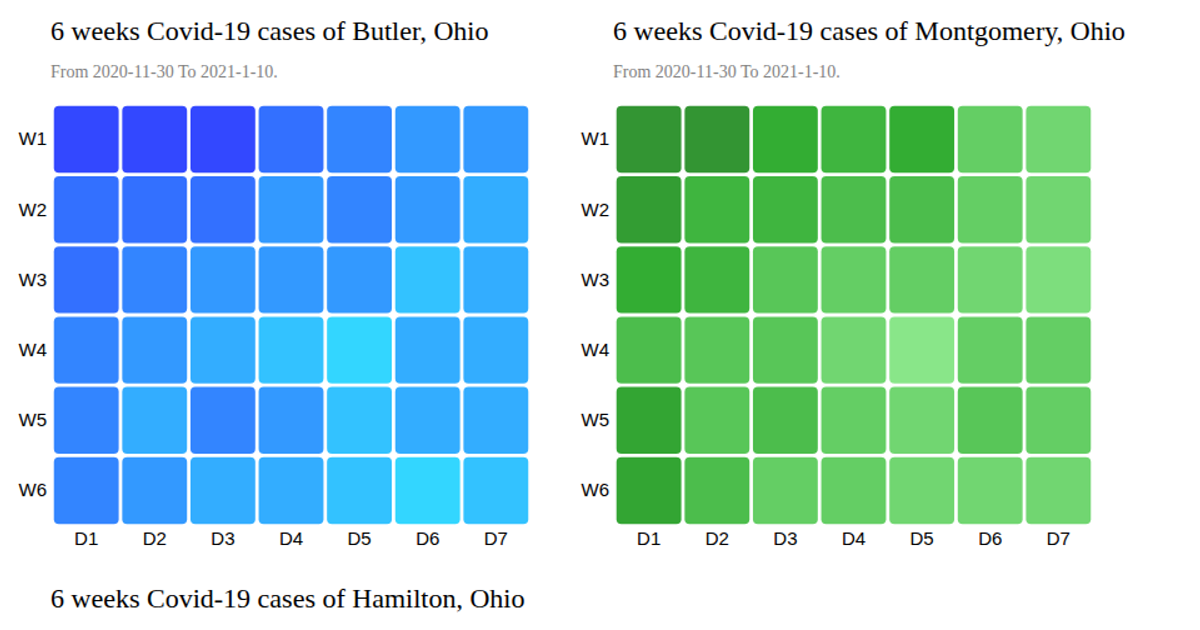
The visualization is a heatmap displaying daily COVID-19 case counts for Butler County, Ohio, over six weeks. It shows the number of cases for each day of the week (D1–D7) across the six weeks (W1–W6), with color intensity representing case volume. The graphic uses D3.js v6, specifically `d3.csv` to load the data and `d3.scaleBand` for the axes. A tooltip appears on hover, revealing the county, date, and exact case count. The color scale interpolates between cyan and blue to denote case-count ranges.
AI-generated descriptionMIT Licensed



Comments
Sign in to join the discussion.