🌍 Public
Segments Analysis
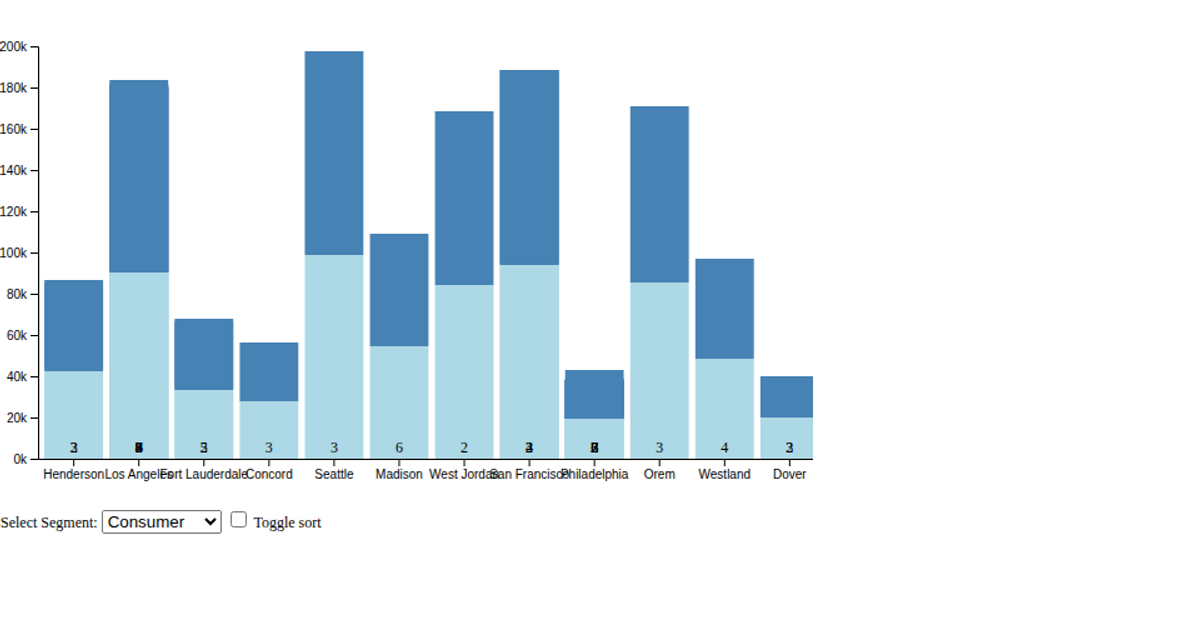
This visualization analyzes four customer segments for a data visualization platform, comparing their estimated market size in USD per year. Vertical bar charts display revenue figures for segments including Educators, Practitioners, Developers, and Researchers. The React application uses D3 v7 scales and axes to render the chart, with bars that respond to clicks. The estimated market size data comes from a CSV file, and the visualization calculates revenue labels using D3's format function.
AI-generated descriptionMIT Licensed



Comments
Sign in to join the discussion.