🌍 Public
Fork of Rose Wind Plot
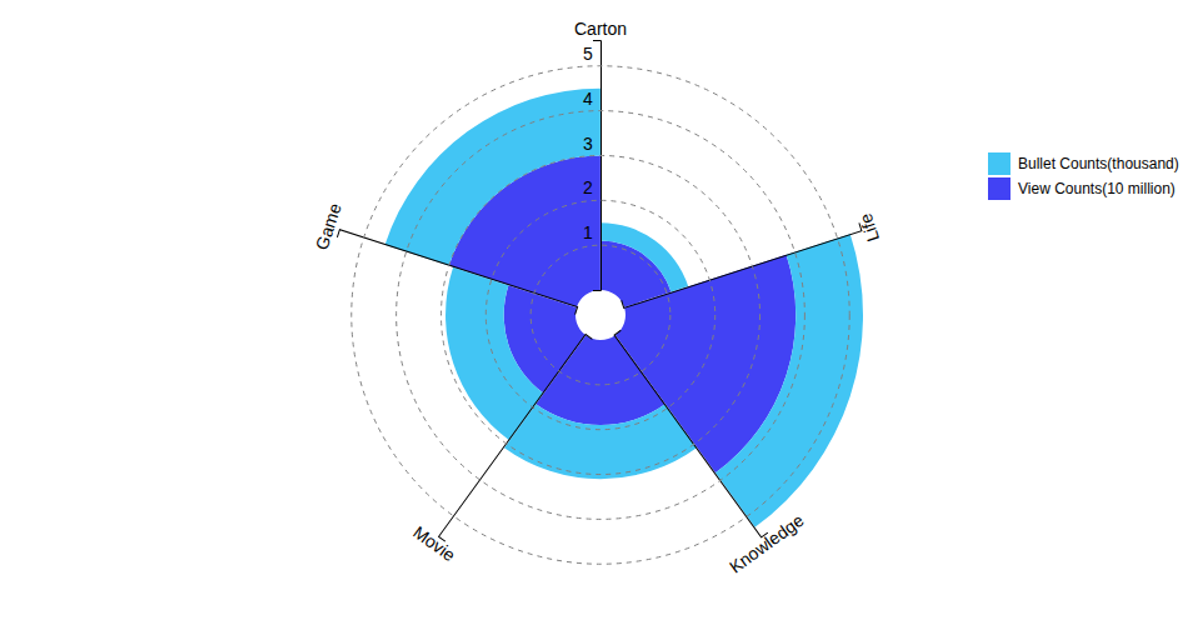
This example presents a radial bar chart, or "rose plot," that visualizes global sales data for various gaming platforms. The chart uses a circular layout with bars extending outward from a central point, with each bar representing a different platform. The visualization is built using D3.js version 6, employing `d3.scaleLinear`, `d3.scaleBand`, and `d3.arc` to construct the wedges, alongside a custom `scaleRadial` function for the radial axis. Data is loaded from a CSV file, and the resulting SVG includes circular gridlines and labels positioned around the perimeter. The plot's angle and radius scales are computed using D3's linear scale, with `d3.stack` handling the data series.
AI-generated descriptionThe original code comes from ssmaroju's Block Wind Rose Plot
MIT Licensed


Comments
Sign in to join the discussion.