🌍 Public
adjust to time
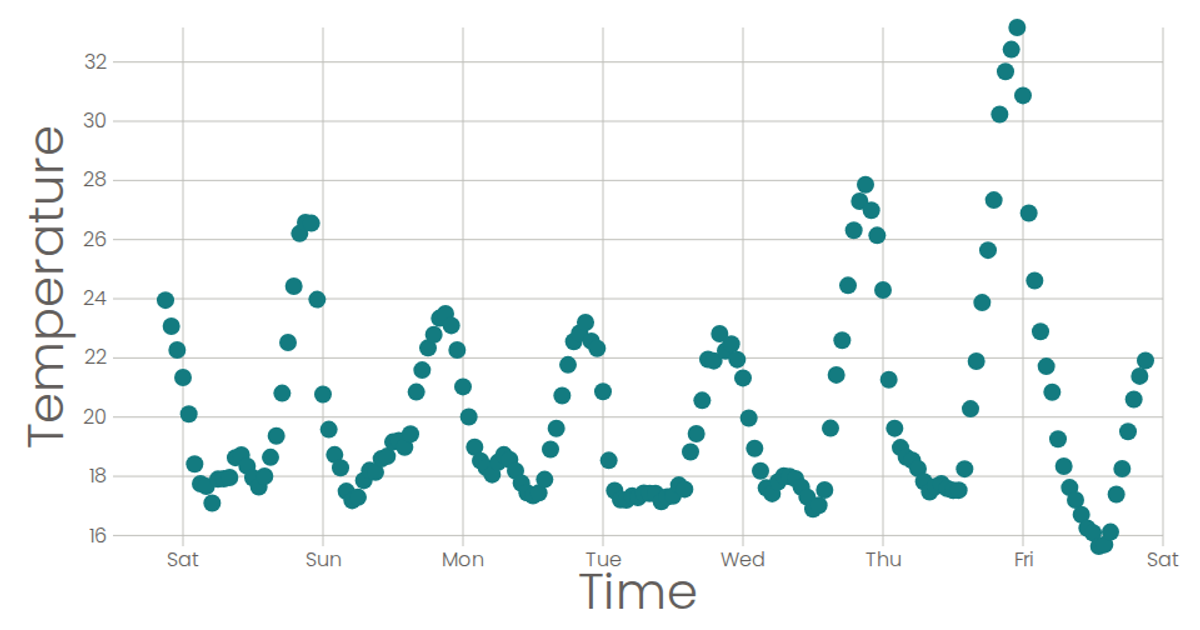
This example visualizes temperature readings over time as a line chart, with the x-axis displaying the day of the week derived from timestamps. It uses a time-based scale for the x-axis and a linear scale for temperature, with axes rendered via custom SVG components. The data is loaded from a CSV file using d3.csv, and the line is drawn with d3.line, while React manages the SVG rendering.
AI-generated descriptionA scatter plot of The Iris Dataset.
MIT Licensed


Comments
Sign in to join the discussion.