🌍 Public
E18 Vega-Lite API Template
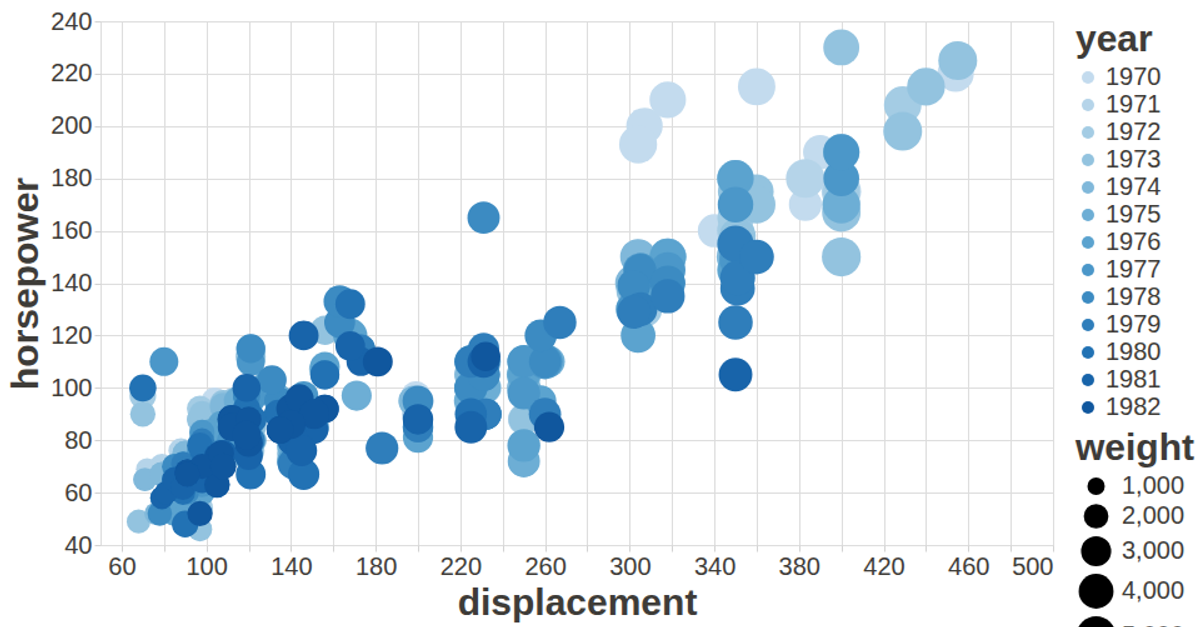
This example visualizes automobile performance and physical characteristics using a Vega-Lite API template. It plots engine displacement against weight, with color encoding by origin and point size representing miles per gallon, using a binned scatterplot of acceleration and displacement as an alternative view. The code loads data from a CSV via d3.csv, then constructs the visualization through the vega-lite-api library, which wraps Vega-Lite specifications. The visualization renders with SVG through Vega’s renderer, includes tooltips via vega-tooltip, and applies custom styling from the config.js file to improve label readability.
AI-generated descriptionA visualization constructed using the vega-lite-api.
MIT Licensed


Comments
Sign in to join the discussion.