🌍 Public
ICE-6 Iris dataset
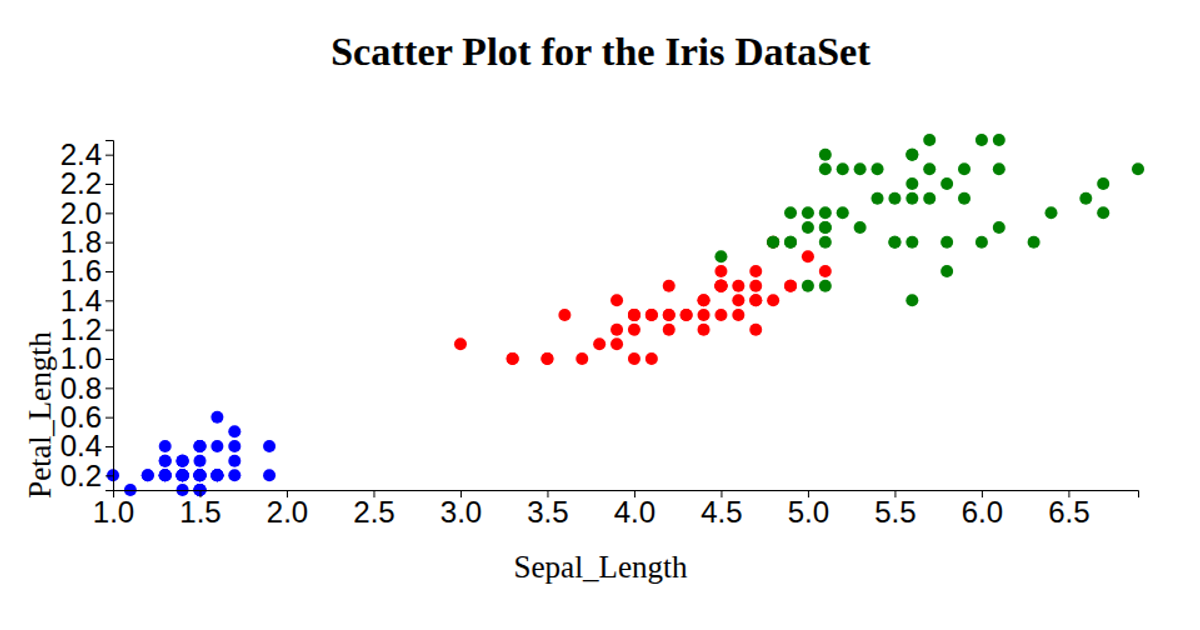
This scatterplot of the classic Iris dataset displays petal length on the x-axis and petal width on the y-axis, with each point colored by species (pink, skyblue, or yellow). The visualization uses D3 v6 to load the data from a GitHub gist, then applies linear scales and axis generators (`axisBottom`, `axisLeft`) to plot the measurements. Circles are rendered as SVG markers with a fixed radius, while the code also reads sepal dimensions but does not use them in the plot, and axis labels are added via D3 text elements.
AI-generated descriptionIn this I used a iris dataset and and created a git link and then by using that link we had created the scatter plot and displayed x-axis and y-axis.
MIT Licensed



Comments
Sign in to join the discussion.