🌍 Public
Leaflet Timeline Slider
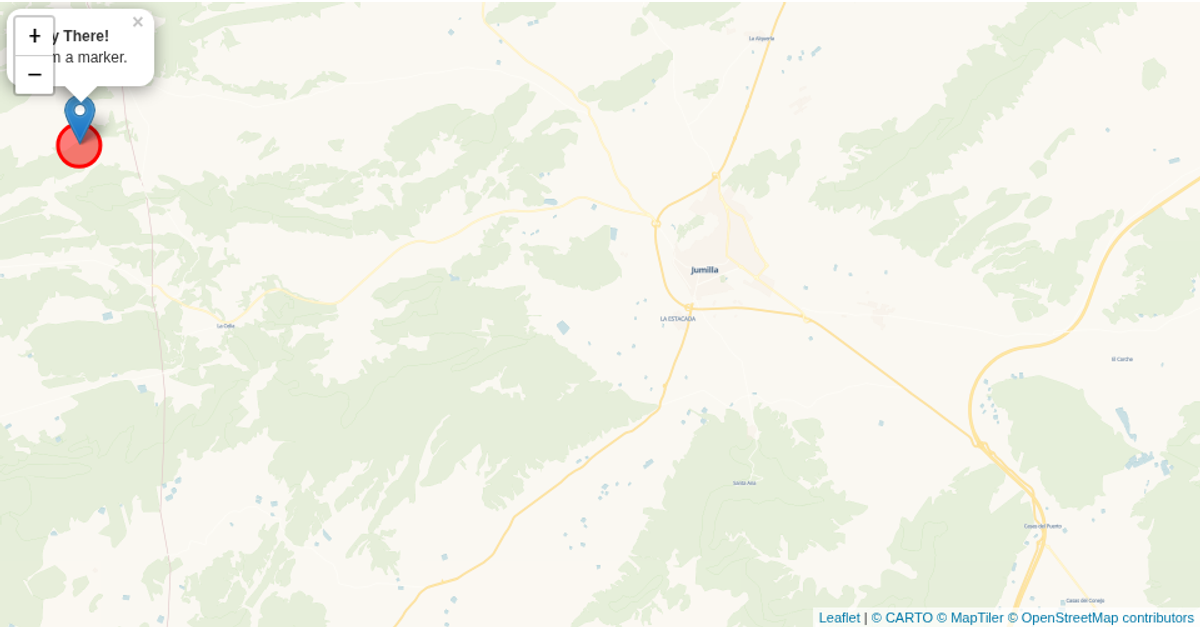
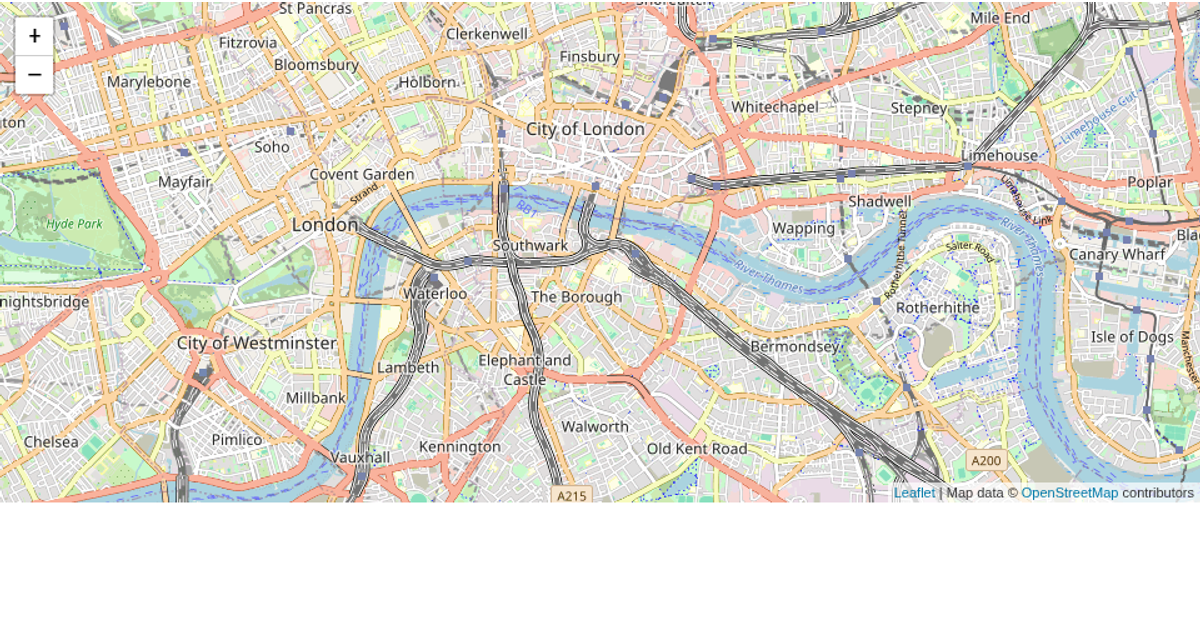
This example uses the Leaflet mapping library to visualize a collection of geographic points as markers on an OpenStreetMap base layer. A timeline slider enables navigation through different story titles, such as "Day 1" and "1776," filtering the displayed GeoJSON features by their title property. When the slider value changes, the code removes existing markers and adds new ones from the filtered data, fitting the map bounds to the marker group and binding popups that show story content and progress. The implementation relies on jQuery and Leaflet's map, tileLayer, geoJson, and featureGroup APIs.
AI-generated descriptionA bare minimum HTML page demonstrating use of CSS and JavaScript.
See also React Starter.
MIT Licensed




Comments
Sign in to join the discussion.