🌍 Public
AQI Over Time
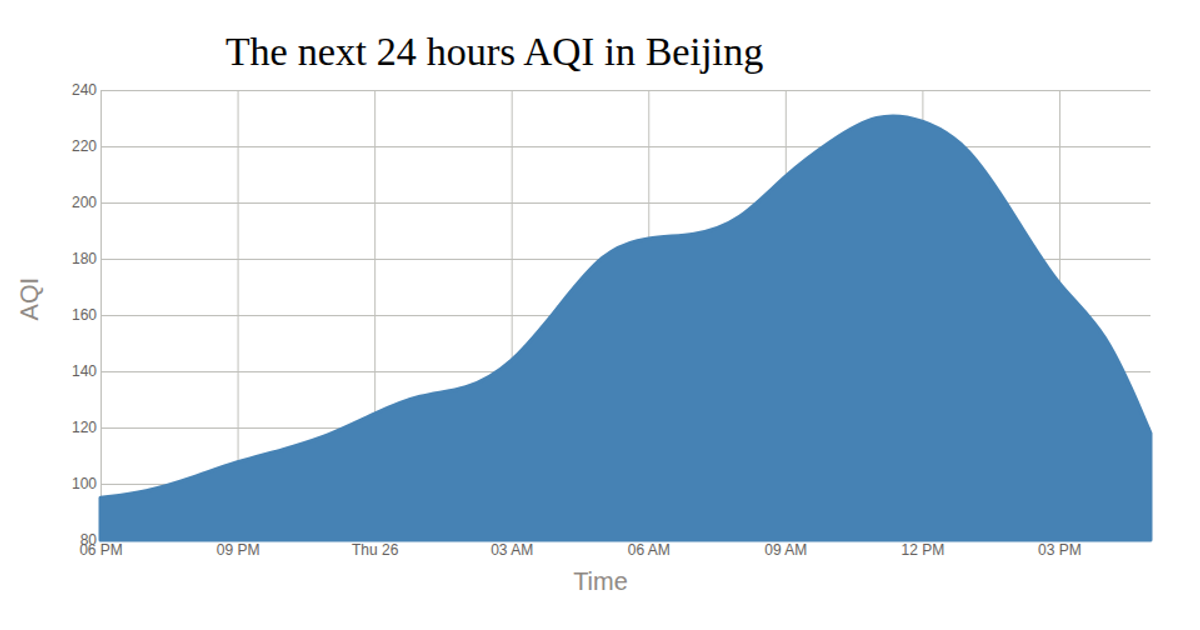
This visualization tracks Air Quality Index (AQI) over time for Chinese cities, beginning with a series of hourly line charts for Beijing, and then shifting to a stacked area chart showing monthly AQI totals for Beijing, Tianjing, Shanghai, and Guangzhou. The first chart uses Vega-Lite and d3.csv to render the data, while the second employs d3.stack, d3.area, d3.areaLabel, and d3.scaleOrdinal to build the stacked areas. Both chart components are responsive, re-rendering on window resize to fill the available viewport.
AI-generated descriptionMIT Licensed




Comments
Sign in to join the discussion.