🌍 Public
AK_viz
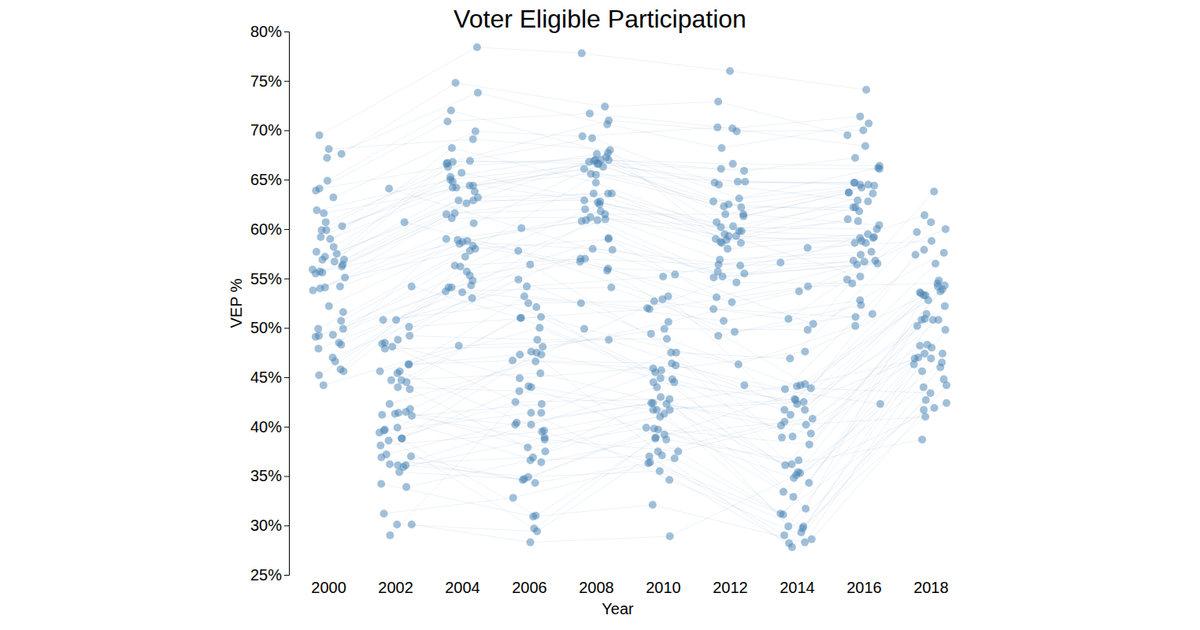
AK_viz visualizes Texas county-level election results, comparing voter turnout and partisanship between 2012 and 2018 Senate races. Each circle represents a county positioned by its partisan margin and turnout, with size encoding population, while lines with arrowheads connect the same county’s two-year transition. The SVG animation uses D3 v5 transitions and scales, with mouseover handlers highlighting counties and a dropdown menu for selection. Data is loaded from a CSV and processed via ES6 modules, with random values generated for 2018 metrics.
AI-generated descriptionScatterplot test. This is a description using Markdown.
MIT Licensed




Comments
Sign in to join the discussion.