🌍 Public
World Map
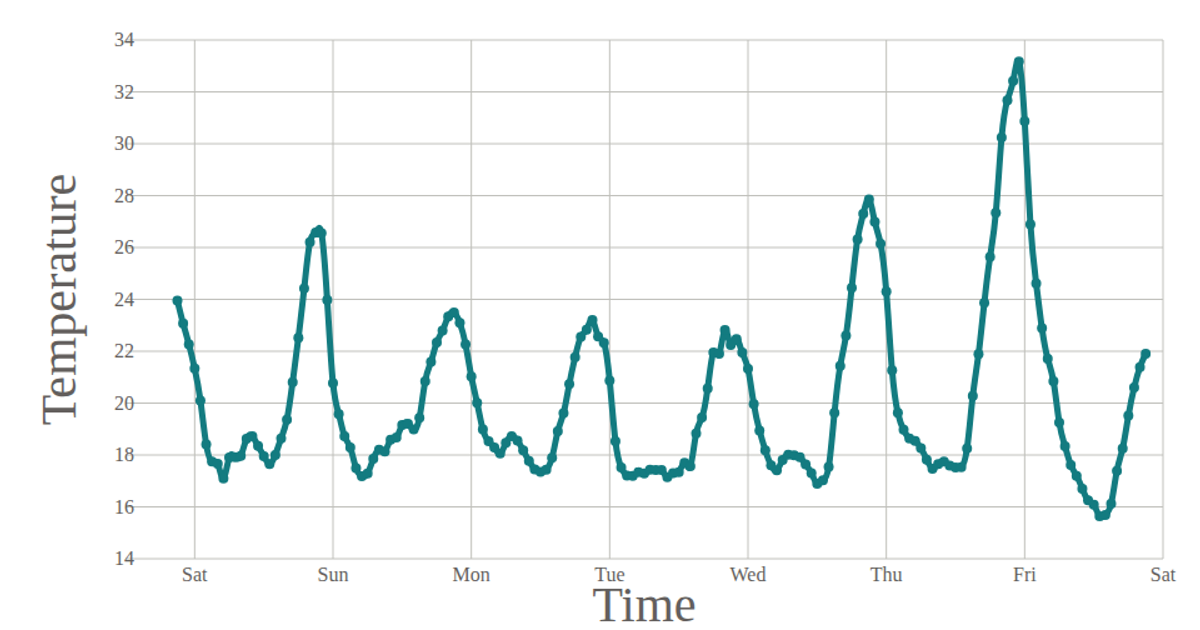
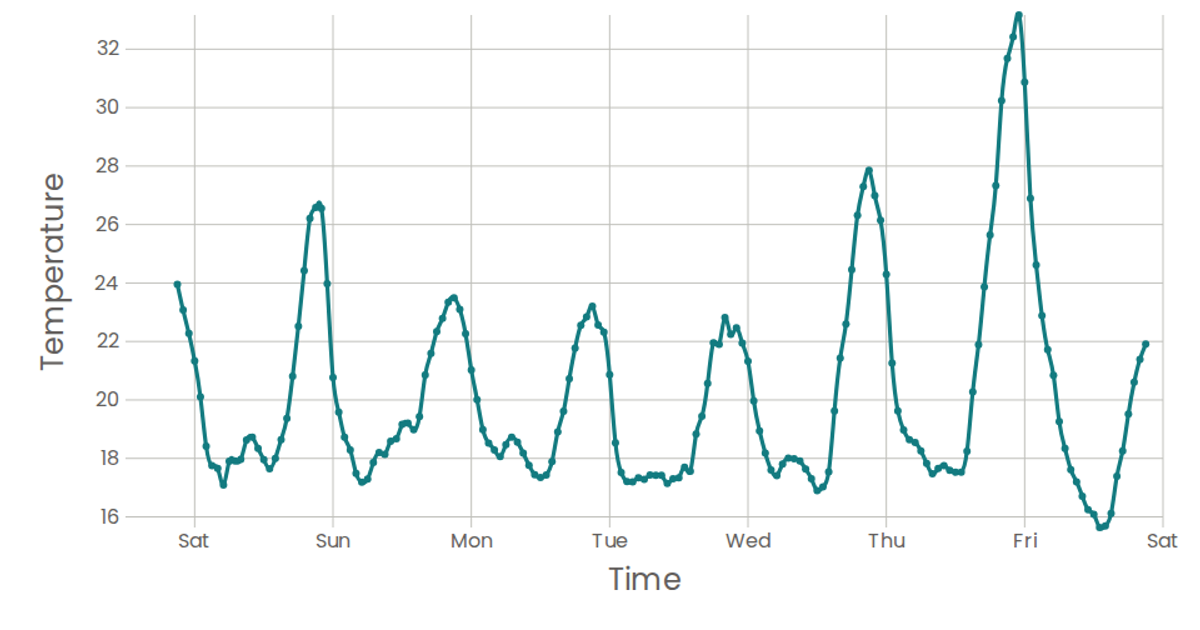
A line chart shows temperature readings from San Francisco over one week, plotting timestamp against temperature with connected points and labeled axes. Data loads asynchronously from a CSV file via a custom `useData` hook built on `d3.csv`. React renders SVG elements including `d3.scaleTime` and `d3.scaleLinear` scales, while the `Marks` component draws the natural curve path using `d3.line` with `curveNatural` and adds circles for each data point.
AI-generated descriptionA programme that laods using D3 and using React to keep track
MIT Licensed


Comments
Sign in to join the discussion.