🌍 Public
Fork of Fork of area chart
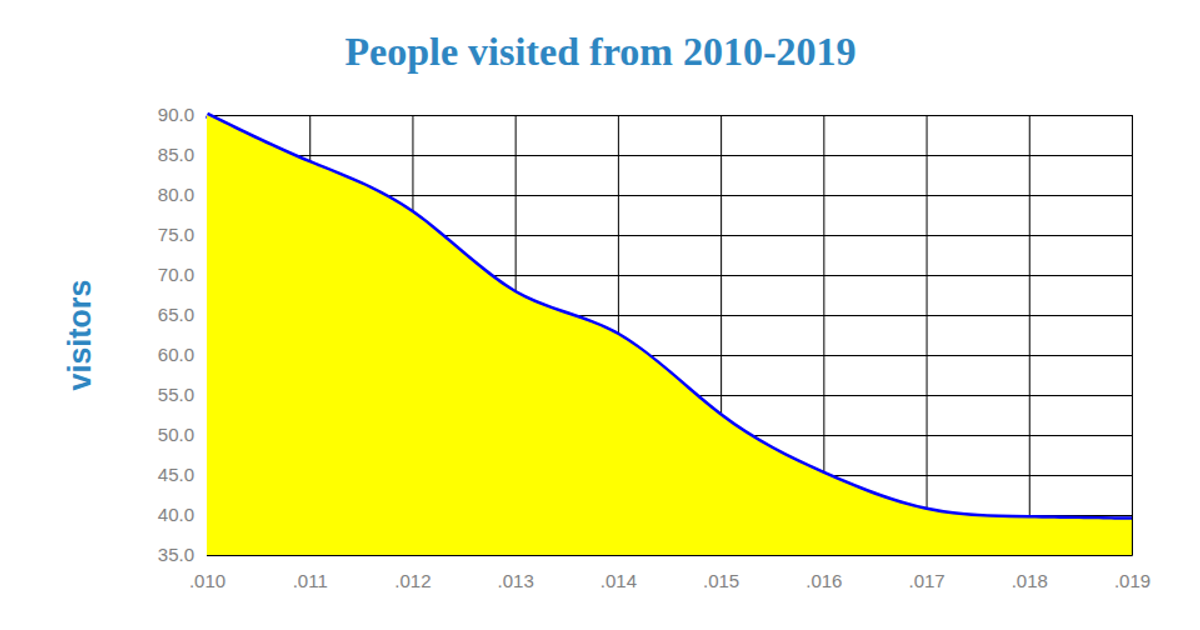
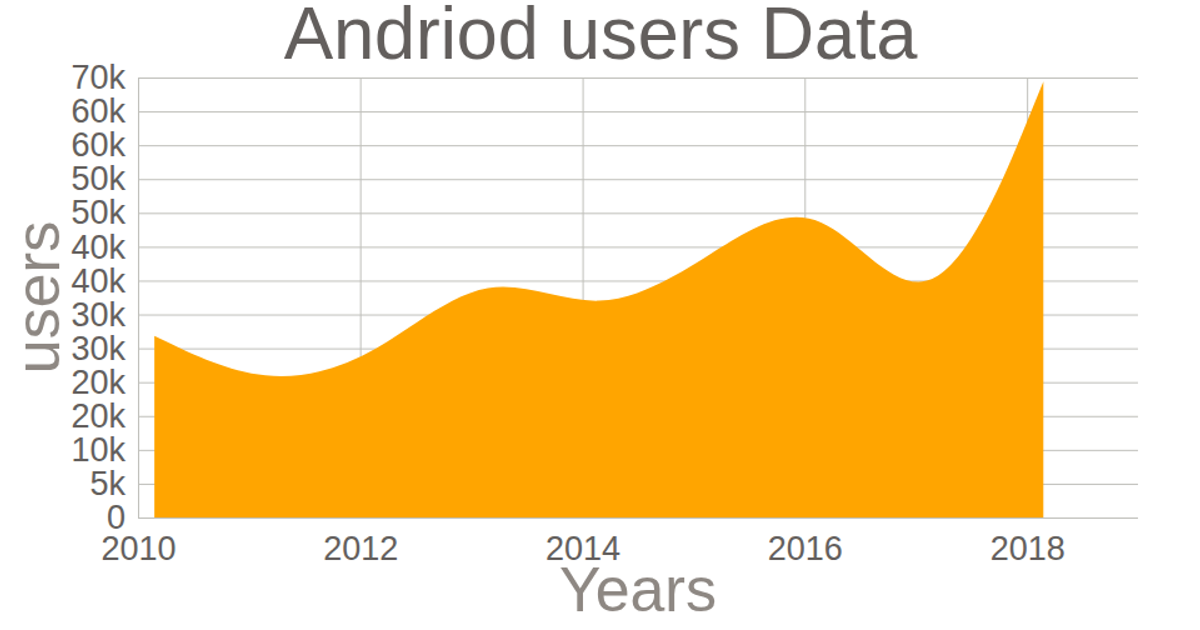
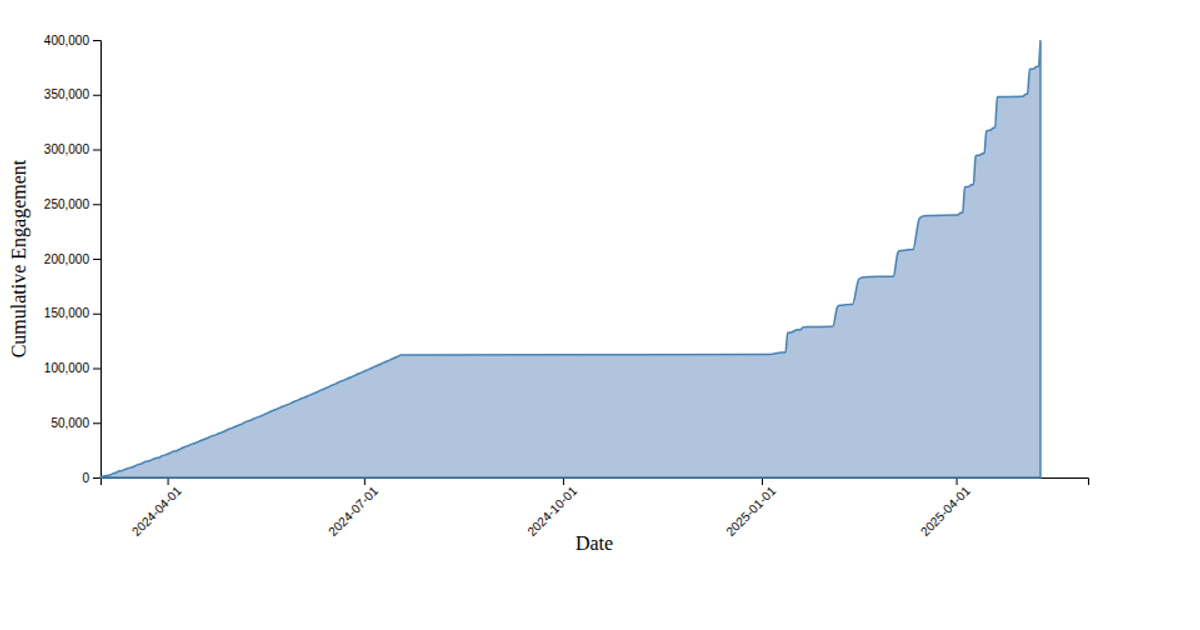
This area chart shows film visitors per year in millions from 1990 to 2015, revealing a sharp decline in the early 1990s followed by a gradual recovery. The Chart.js library renders the visualization as an SVG or canvas line chart with a filled area beneath the curve, using smooth tension and hoverable data points. The code maps year data to the x-axis and visitor counts to the y-axis, with explicit axis labels and a legend.
AI-generated descriptionMIT Licensed



Comments
Sign in to join the discussion.