Test2 answer for Big Data Management Final Project
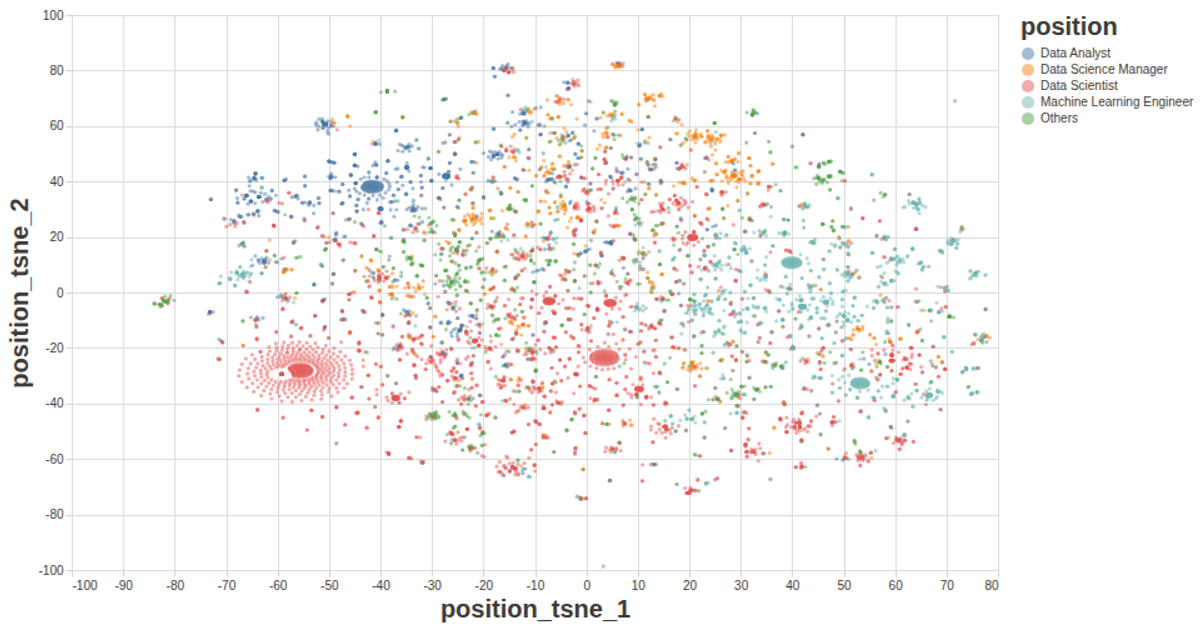
This scatterplot visualizes the results of a local outlier factor (LOF) analysis, with each point colored dark green and its opacity scaled by the LOF value—higher LOF points appear darker, indicating greater outlierness. Hovering over a point reveals a tooltip showing the exact LOF score. The visualization uses React with D3 v5 modules including `scaleLinear` for axes and `csv` for data loading from a GitHub-hosted CSV file. The example is built with SVG rendering and custom React components for axes and marks.
AI-generated descriptionThe data shown here comes from ans2.csv.
This visualization has tooltip function, so be sure to hover over each point ;)
The opacity of each point depends on it's LOF value, i.e. the higher LOF value is, the darker the point is, which means the more "outlier" this point is.




Comments
Sign in to join the discussion.