🌍 Public
Activity6_Tutorial 3.2
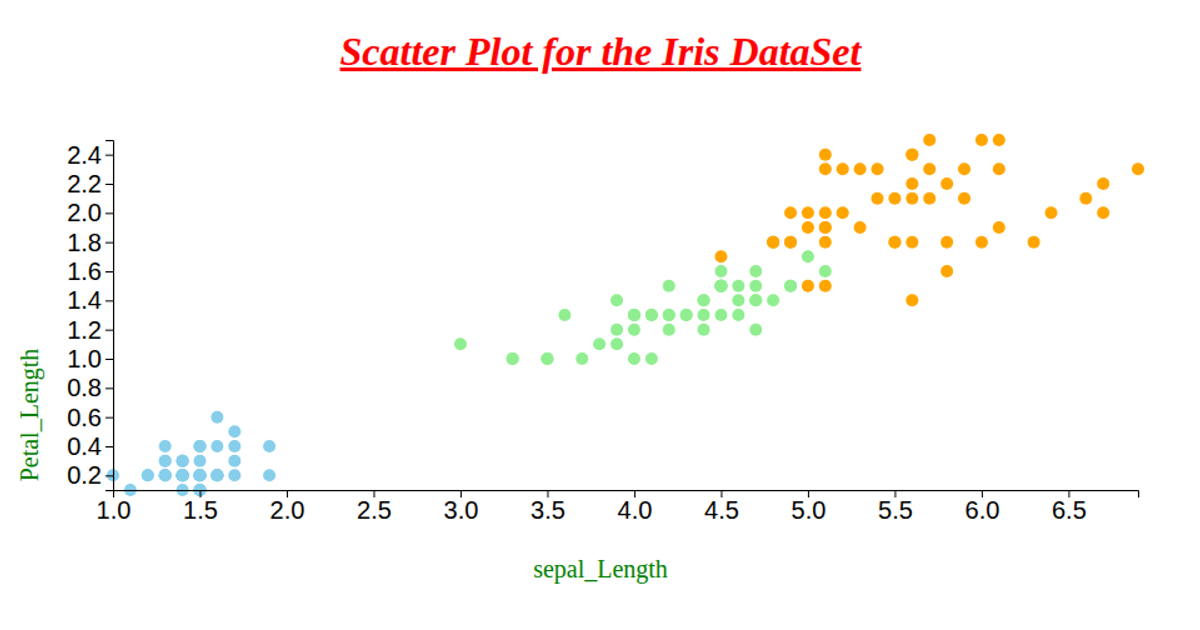
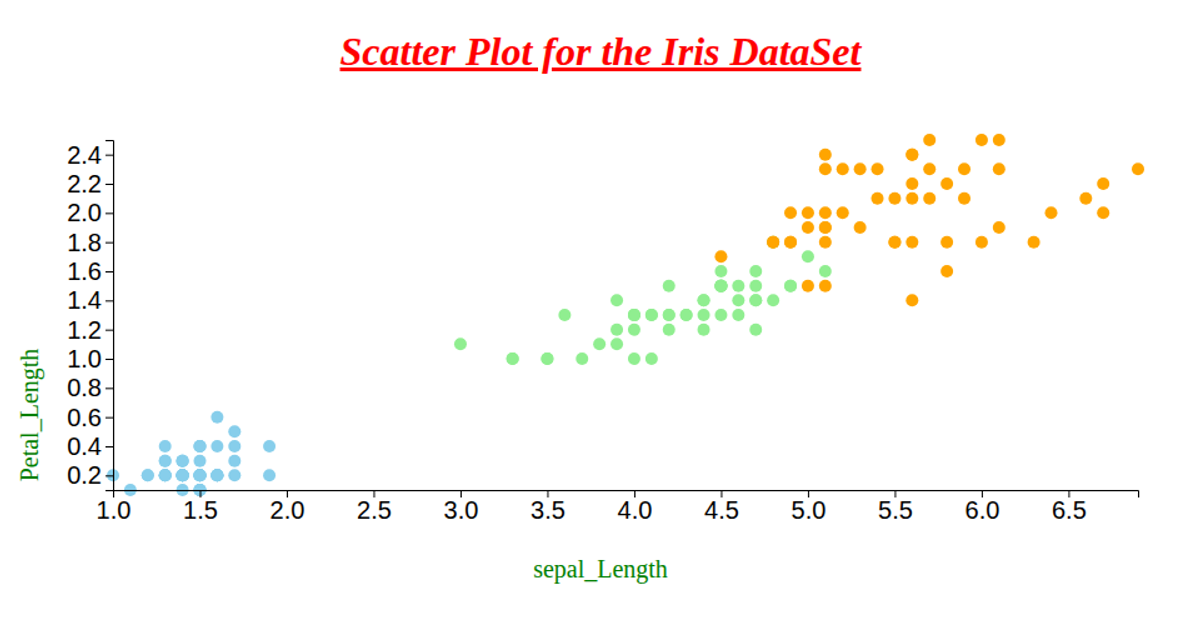
This scatter plot visualizes the Iris dataset, mapping petal length and petal width for individual flowers while coloring each point by species. It uses D3 v6 APIs including `csv`, `scaleLinear`, `extent`, `axisLeft`, and `axisBottom` to load data, create scales, and render SVG axes and circles. The chart encodes only petal dimensions spatially, with a static categorical color scheme for species.
AI-generated descriptionMIT Licensed


Comments
Sign in to join the discussion.