Fork of Scatter Plot Simple
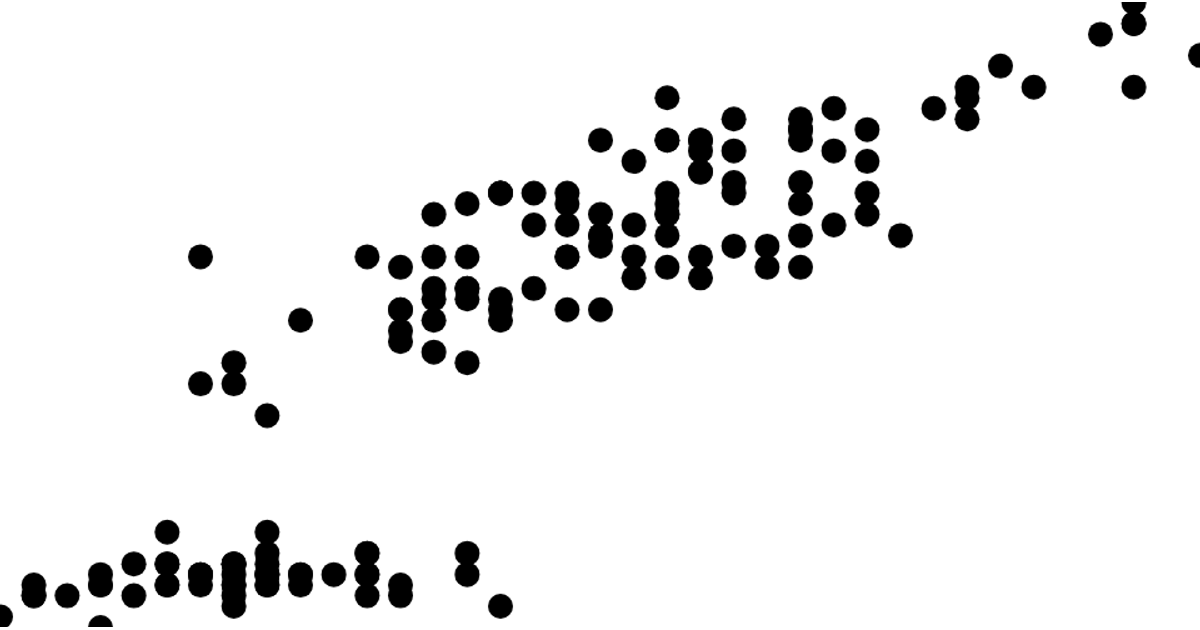
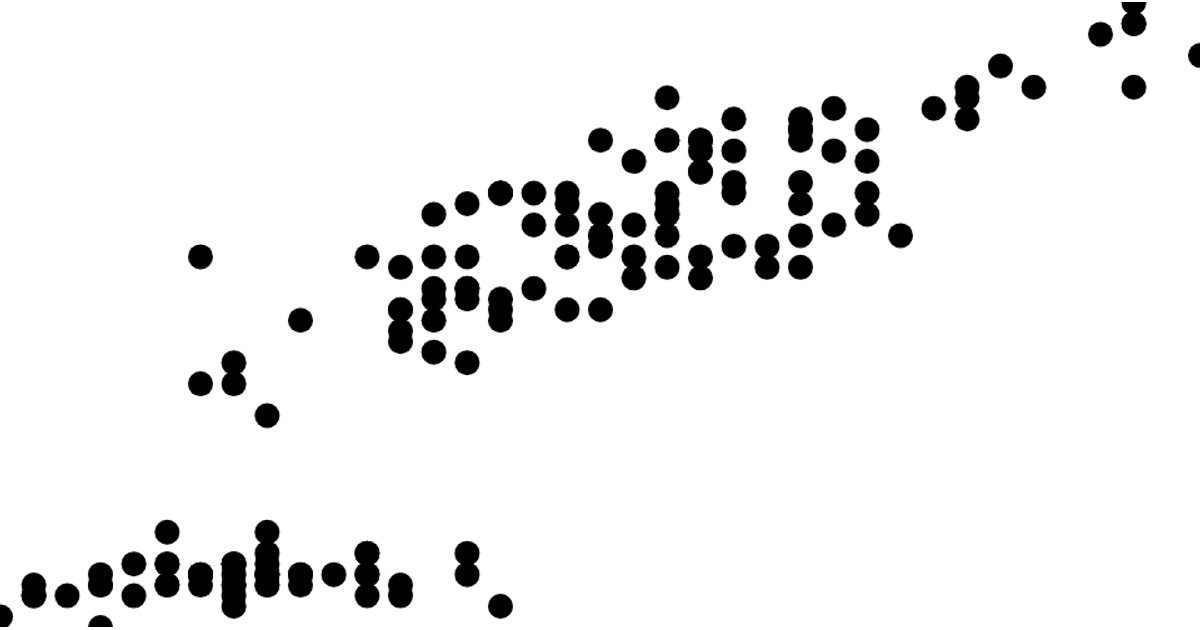
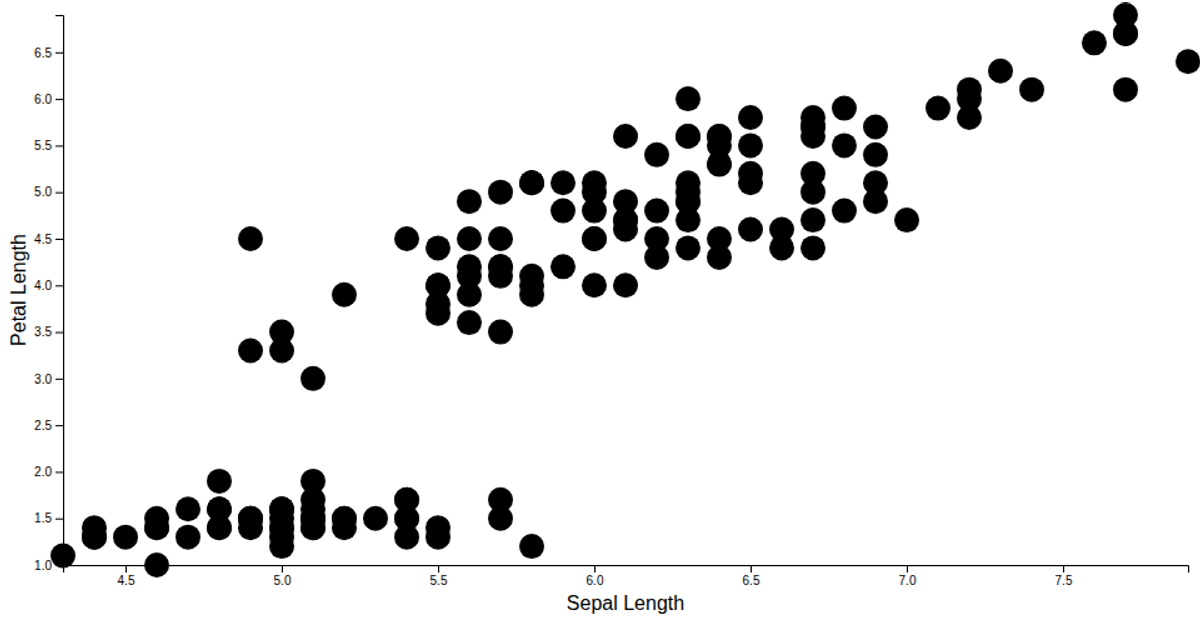
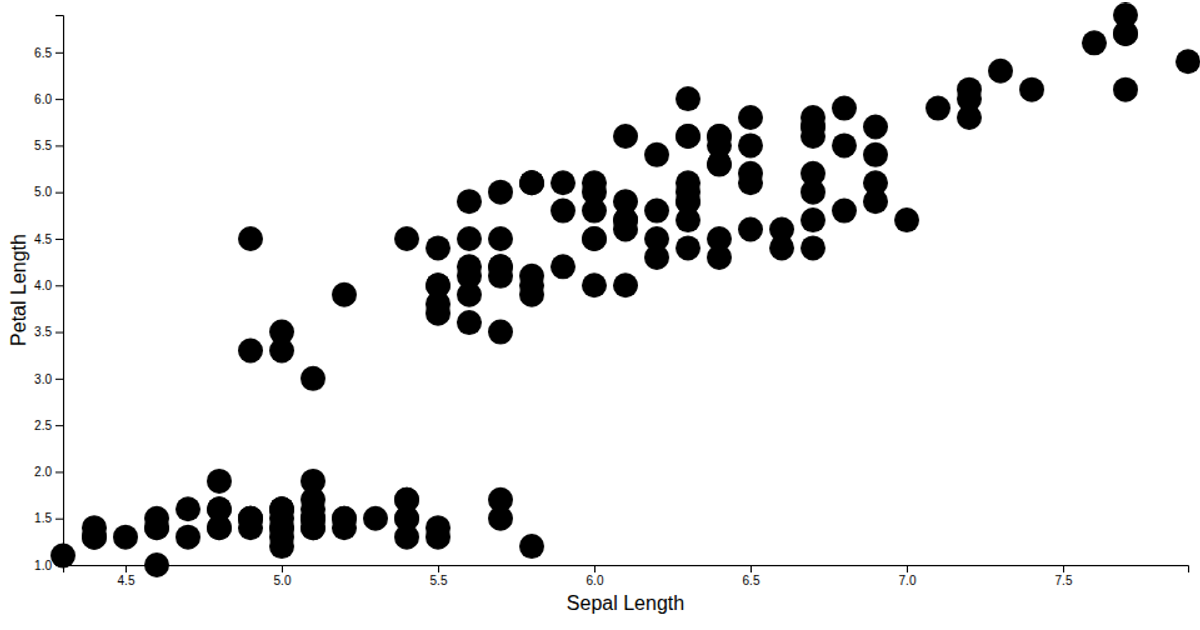
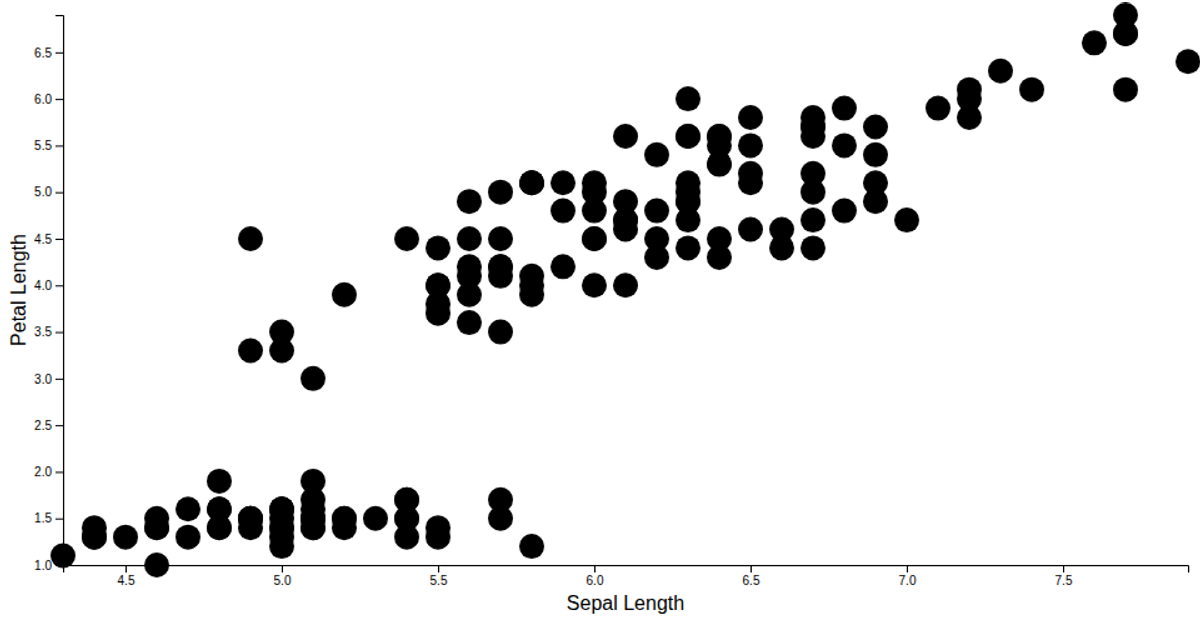
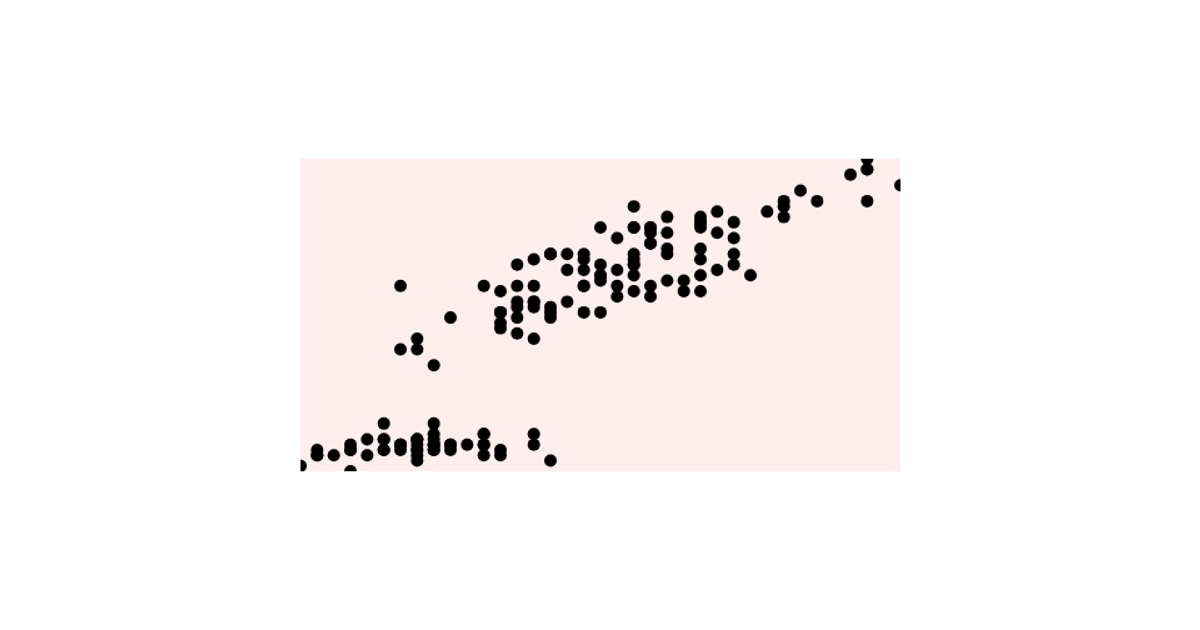
This example forks the classic Iris Dataset scatter plot, rendering sepal length and petal width as a simple dot plot with no axes. The visualization uses a minimal aesthetic, drawing each of the 150 flowers as a point, with the data loaded from a CSV file. While the chart omits axes entirely, the four numeric dimensions of the dataset (sepal length, sepal width, petal length, petal width) are present in the data and could be mapped to the x/y positions and styling of the points. The species of each iris is also encoded in the data, though not explicitly visualized here. This plot emphasizes raw data points over chart furniture, making it a clean starting point for further annotation or interaction.
AI-generated descriptionA scatter plot of the Iris Dataset with no axes.


Comments
Sign in to join the discussion.