🌍 Public
Fork of Making a simple bar chart
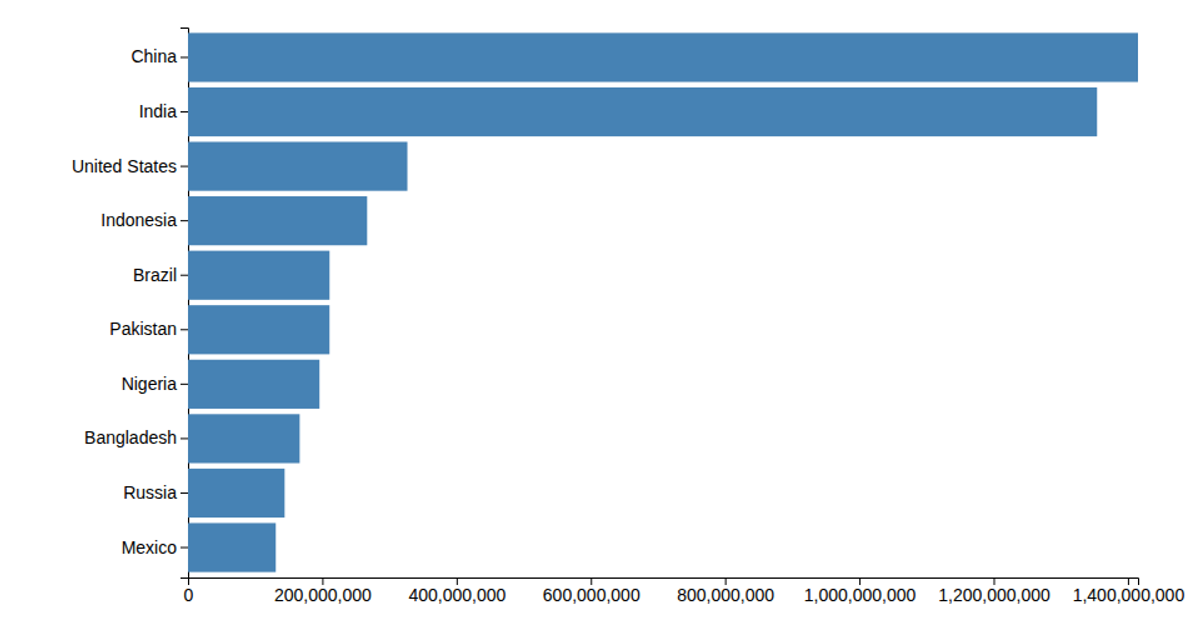
This example shows a horizontal bar chart of the 25 most populous countries in 2020, with population values in millions. It uses d3.csv to load the data and d3.scaleLinear and d3.scaleBand to map populations and country names to positions, while d3.axisLeft and d3.axisBottom generate the axes. The SVG rendering uses d3-selection to append rect elements sized by the linear scale, with the data pre-multiplied by 1000 before display.
AI-generated descriptionMIT Licensed




Comments
Sign in to join the discussion.