🌍 Public
Temperature in San Francisco Areachart
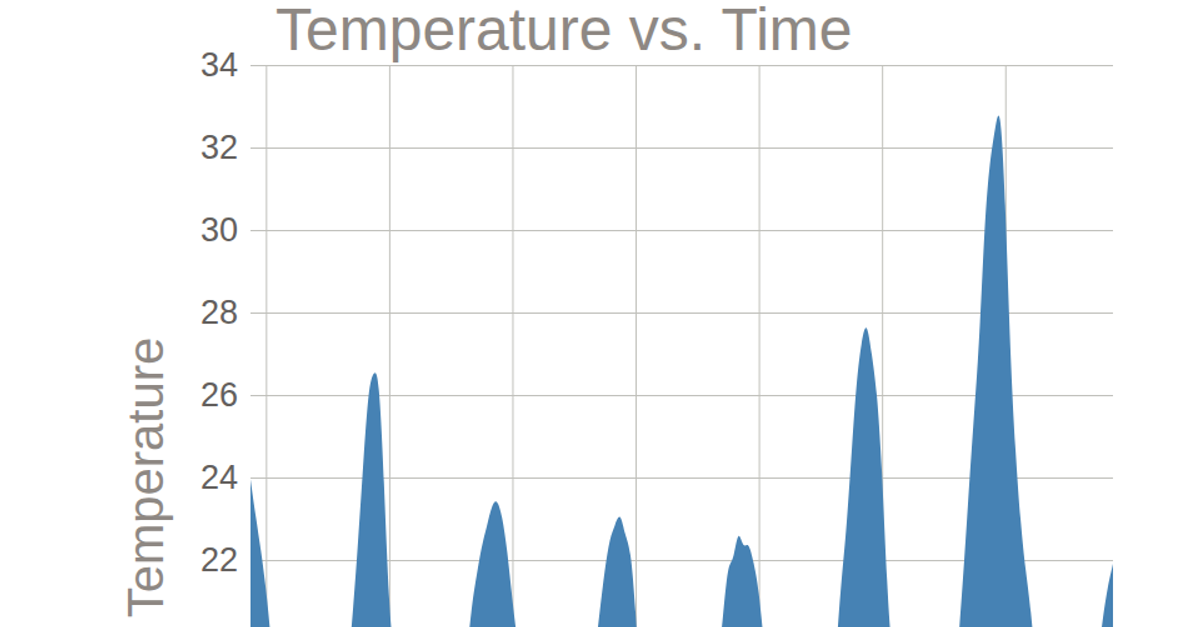
This area chart shows daily temperature fluctuations in San Francisco over a month, with a smooth curve tracing values from 31 to 87 degrees. The visualization uses D3.js v7 APIs including `scaleTime`, `scaleLinear`, `area`, and `curveBasis` to generate the filled path, while `axisBottom` and `axisLeft` add labeled axes with gridlines. Data comes from a local CSV file parsed via `csv()`, and the chart is rendered as SVG within a fixed 960×500 viewport. The maroon area fill emphasizes the temperature range beneath the curve.
AI-generated descriptionThis bar chart shows cool car stuff! - Shea Gazette
MIT Licensed







Comments
Sign in to join the discussion.