🌍 Public
Scatter Plot
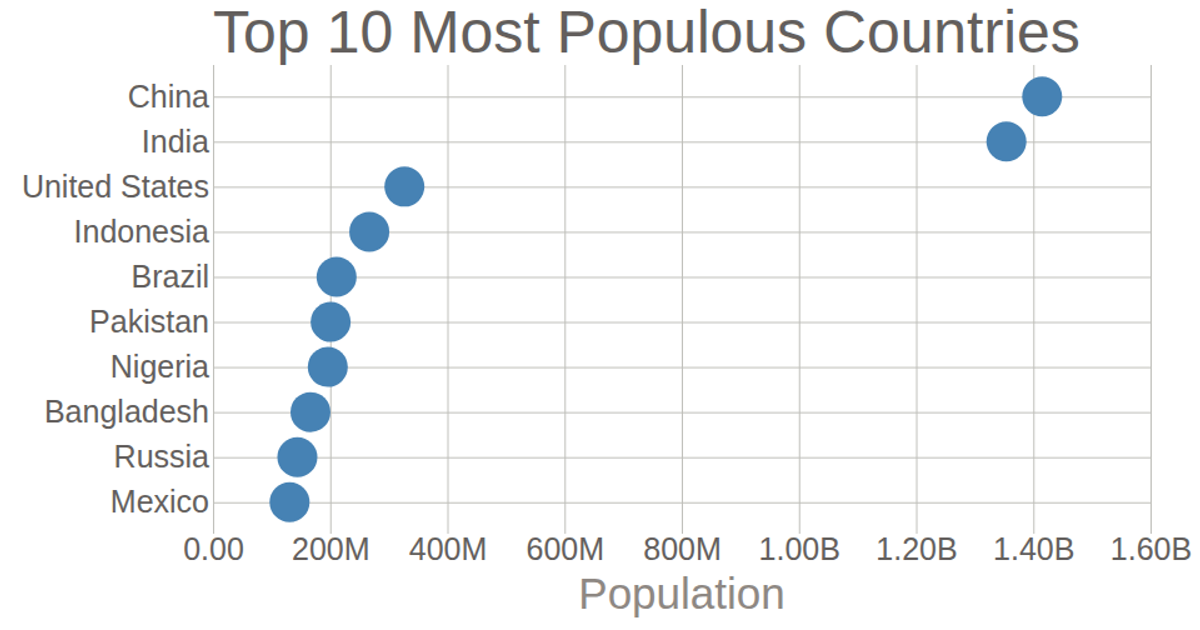
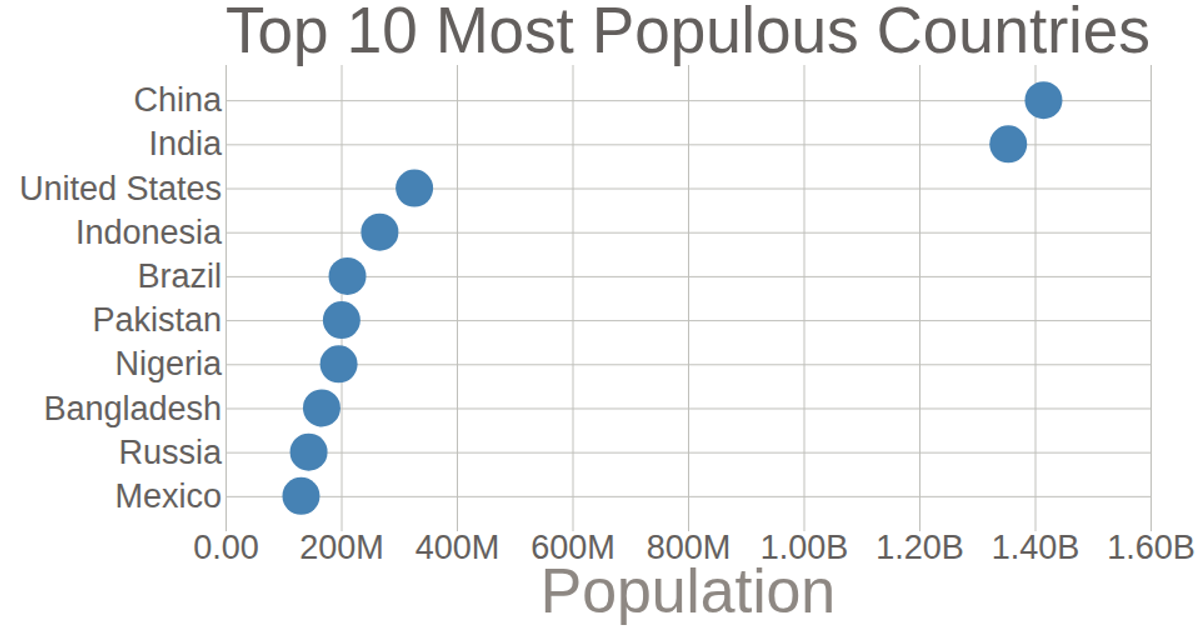
The is a scatter plot that displays the population of the top 10 most populated countries as of 2018, using a dataset imported via `d3.csv`. Circles represent each country, positioned along a linear scale for population and a point scale for country names. The code uses `d3.scaleLinear`, `d3.scalePoint`, `d3.axisLeft`, and `d3.axisBottom` to render axes with custom tick formatting, while styling the SVG output with CSS.
AI-generated descriptionThe featured histogram displays population data of top 10 most populated countries as of 2018
MIT Licensed



Comments
Sign in to join the discussion.